Nobel Prize winners and sales
Packages
We will use the following two packages in this application exercise.
- tidyverse: For data import, wrangling, and visualization.
- readxl: For importing data from MS Excel.
Let’s first load the packages.
library(tidyverse)
library(readxl)
Reading CSV files
For this programming exercise, we are going to work with a data on Nobel Prize winners from the years 1901 through 2018, called nobel.csv.
Load the dataset with read_csv() and save it as a data frame (a tibble) called nobel. How many rows are there in nobel and what does each row represent? How many columns are there in nobel?
Hint 1
Read in the data with read_csv() and pass the name of the data file, "nobel.csv" as the argument of this funtion.
___ <- read_csv("nobel.csv")
Hint 2
Assign the result of read_csv("nobel.csv") to nobel.
nobel <- read_csv("nobel.csv")
Solution
There are 935 rows and 26 columns in nobel data frame. Each row represents a Nobel prize winner.
nobel <- read_csv("nobel.csv")

nobel
Now, read the data in again, but this time add the argument show_col_types to the read_csv() function and set it to `FALSE. This will suppress the information on column specifications (what type each column is).
Solution
nobel <- read_csv("nobel.csv", show_col_types = FALSE)Notice that the column specification is no longer printed.
Variable types and classes
We are going to use the nobel dataset to explore how to change types of variables and what can go wrong along the way.
Using glimpse(), identify what type of variable category is in the nobel data frame. Additionally, identify the values this variable takes.
Hint 1
glimpse(nobel)
Hint 2
glimpse(nobel)

nobel |>
  distinct(category)
Solution
category is a character variable. This variable takes on the following values: Physics, Chemistry, Peace, Medicine, Literature, and Economics.
glimpse(nobel)

nobel |>
  distinct(category)
Suppose we want to convert the the levels of category into numeric values.
Run the following code. What happens?
Solution
When trying to convert the values of caegory from characters into numbers, each value became an NA. And we got a warning that says NAs introduced by coercion.
It makes sense that R can’t just represent character strings as numbers. Instead of converting a character variable to a numeric, we might consider converting it to a factor variable instead – how R represents categorical data.
Convert category to factor and save it in the nobel data frame. Then, report its levels.
Hint 1
nobel <- nobel |>
  ___(___)
Hint 2
nobel <- nobel |>
  mutate(___ = as.factor(___))
Hint 3
nobel <- nobel |>
  mutate(category = as.factor(category))
Solution
The levels are Physics, Chemistry, Peace, Medicine, Literature, and Economics.
nobel <- nobel |>
  mutate(category = as.factor(category))

levels(nobel$category)
Reading Excel files
For the remainder of this programming exercise, we are going read in data from an Excel file and then clean it up.
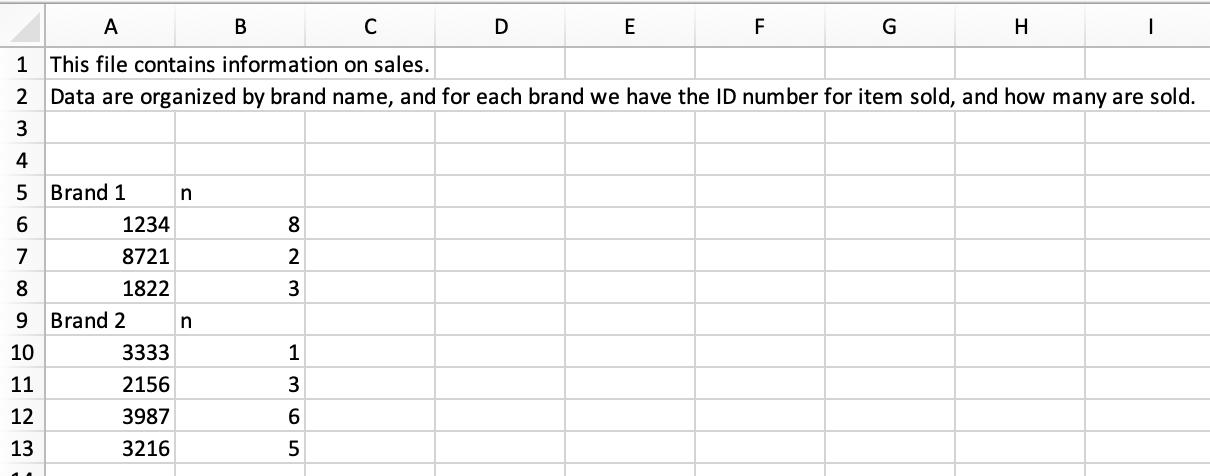
First, read the data in with read_excel from the Excel file called "sales.xlsx" and print the data to screen. Is this a tidy data frame?
Hint 1
___ <- read_excel("___")
Hint 2
sales <- read_excel("sales.xlsx")
Hint 3
sales <- read_excel("sales.xlsx")
sales
Solution
sales <- read_excel("sales.xlsx")
sales
No, this is not a tidy data frame. These data are read in with the text as a column name, and creates another column name called ...2.
See the help file for read_excel() here. Notice that, in the current sales dataset, we want to skip 3 rows (the first row acts as a header for the column names). We can do this using the skip argument. At the same time, we can specify names for each column by giving the argument col_names a character vector.
Read in the file called "sales.xlsx", experimenting with skip and col_names arguments to skip 3 lines and name the columns id and n.
Hint 1
___ <- read_excel(
  "sales.xlsx",
  ___,
  ___
)
Hint 2
___ <- read_excel(
  "sales.xlsx",
  skip = 3,
  ___
)
Hint 3
___ <- read_excel(
  "sales.xlsx",
  skip = 3,
  col_names = c("id", "n")
)
Solution
sales <- read_excel(
  "sales.xlsx",
  skip = 3,
  col_names = c("id", "n")
)

sales
Putting it all together
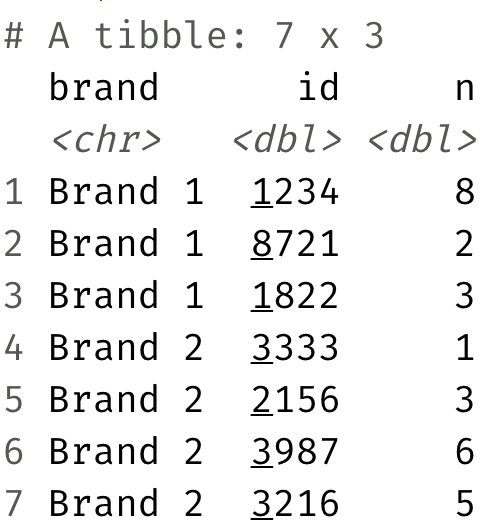
Manipulate the sales data such such that it looks like the following using functions you have learned from the tidyverse to transform data.
Hint 1
Use mutate() to create a new column.
sales |>
  mutate(
    ___,
    ___
  ) |>
  ___
  ___
  ___
Hint 2
Use str_detect() to identify rows with the text "Brand".
sales |>
  mutate(
    is_brand_name = str_detect(id, "Brand"),
    ___
  ) |>
  ___
  ___
  ___
Hint 3
If a row has the text "Brand", leave the value of id, otherwise name it NA.
sales |>
  mutate(
    is_brand_name = str_detect(id, "Brand"),
    brand = if_else(is_brand_name, id, NA)
  ) |>
  ___
  ___
  ___
Hint 4
Fill in empty rows in the brand column.
sales |>
  mutate(
    is_brand_name = str_detect(id, "Brand"),
    brand = if_else(is_brand_name, id, NA)
  ) |>
  fill(brand) |>
  ___
  ___
Hint 5
Filter out any rows with NA in the is_brand_name column.
sales |>
  mutate(
    is_brand_name = str_detect(id, "Brand"),
    brand = if_else(is_brand_name, id, NA)
  ) |>
  fill(brand) |>
  filter(!is_brand_name) |>
  ___
Solution
Select the columns brand, id, and n.
sales |>
  mutate(
    is_brand_name = str_detect(id, "Brand"),
    brand = if_else(is_brand_name, id, NA)
  ) |>
  fill(brand) |>
  filter(!is_brand_name) |>
  select(brand, id, n)

sales
Takeaway
We should write code to manipulate data instead of opening Excel and editing the data in there because it leaves a transparent trail of any modifications done while manipulating the data. Making changes directly to an Excel file to reshape and clean data is neither reproducible nor reusable.