Data classes


Data tidying and importing

Data Science with R

Data classes

Data classes

We talked about types so far, next we’ll introduce the concept of classes

  • Vectors are like Lego building blocks
  • We stick them together to build more complicated constructs, e.g. representations of data
  • The class attribute relates to the S3 class of an object which determines its behaviour
    • You don’t need to worry about what S3 classes really mean, but you can read more about it here if you’re curious
  • Examples: factors, dates, and data frames

Factors

R uses factors to handle categorical variables, variables that have a fixed and known set of possible values

x <- factor(c("BS", "MS", "PhD", "MS"))
x
[1] BS  MS  PhD MS 
Levels: BS MS PhD
typeof(x)
[1] "integer"
class(x)
[1] "factor"

More on factors

We can think of factors like character (level labels) and an integer (level numbers) glued together

glimpse(x)
 Factor w/ 3 levels "BS","MS","PhD": 1 2 3 2
as.integer(x)
[1] 1 2 3 2

Dates

y <- as.Date("2025-01-01")
y
[1] "2025-01-01"
typeof(y)
[1] "double"
class(y)
[1] "Date"

More on dates

We can think of dates like an integer (the number of days since the origin, 1 Jan 1970) and an integer (the origin) glued together

as.integer(y)
[1] 20089
as.integer(y) / 365 # roughly 55 yrs
[1] 55.03836

Data frames

We can think of data frames like like vectors of equal length glued together

df <- data.frame(x = 1:2, y = 3:4)
df
  x y
1 1 3
2 2 4
typeof(df)
[1] "list"
class(df)
[1] "data.frame"

Lists

Lists are a generic vector container; vectors of any type can go in them

l <- list(
  x = 1:4,
  y = c("hi", "hello", "jello"),
  z = c(TRUE, FALSE)
)
l
$x
[1] 1 2 3 4

$y
[1] "hi"    "hello" "jello"

$z
[1]  TRUE FALSE

Lists and data frames

  • A data frame is a special list containing vectors of equal length
  • When we use the pull() function, we extract a vector from the data frame
df
  x y
1 1 3
2 2 4
df |>
  pull(y)
[1] 3 4

Working with factors

Read data in as character strings

handedness <- read_csv("data/handedness.csv")
glimpse(handedness)
Rows: 60
Columns: 2
$ name       <chr> "Abdiel Camacho", "Abram Sanders", "Ady…
$ preference <chr> "left", "ambidextrous", "right", "right…

But coerce when plotting

ggplot(handedness, mapping = aes(x = preference)) +
  geom_bar()

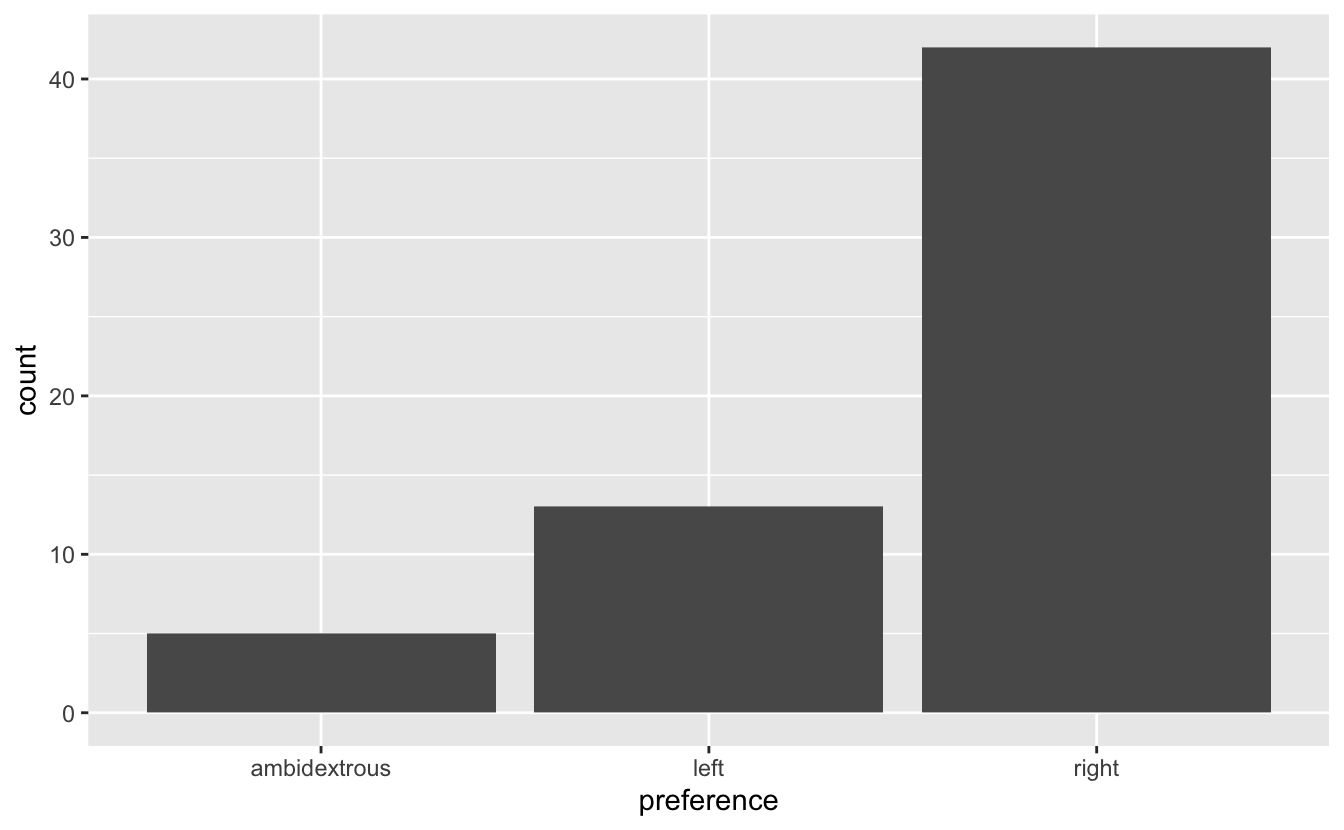
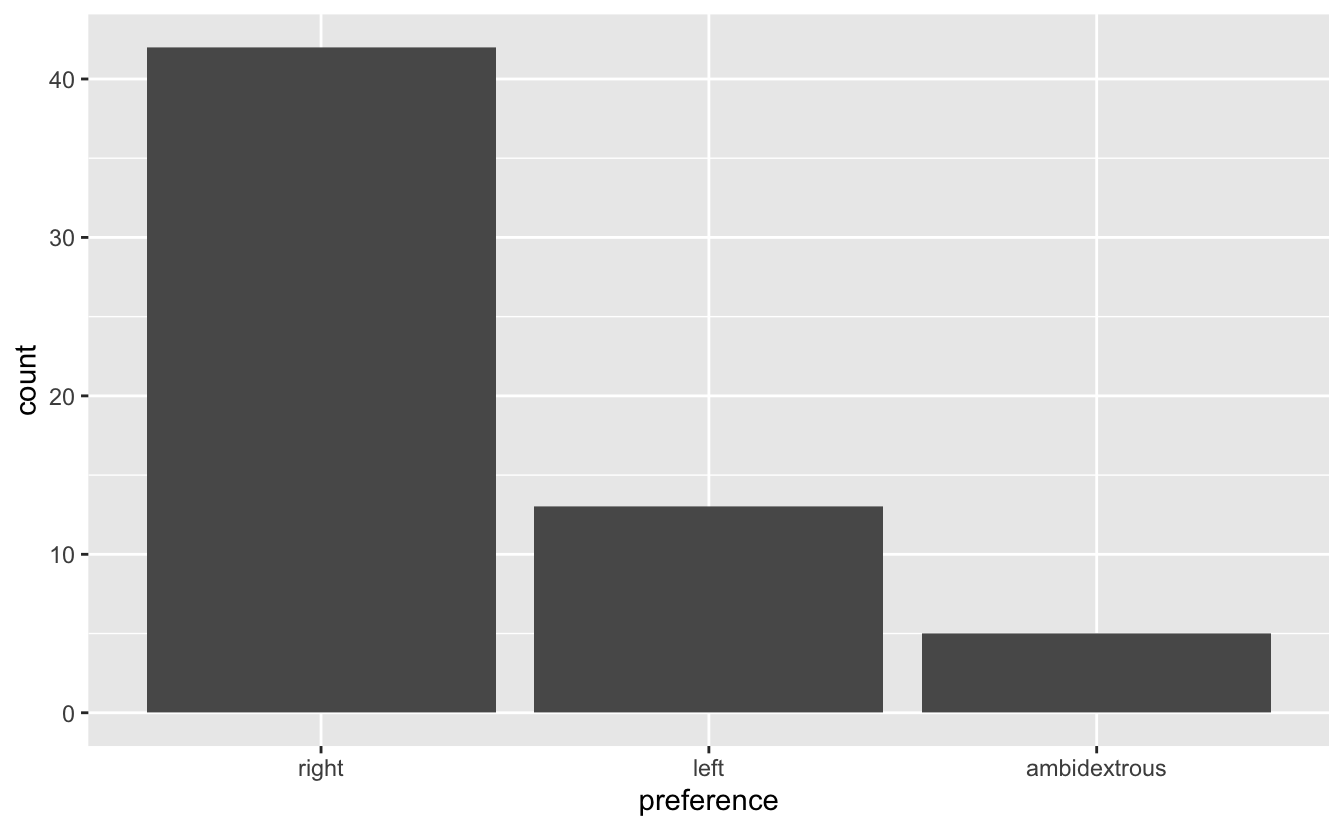
Use forcats to manipulate factors

handedness |>
  mutate(preference = fct_infreq(preference)) |>
  ggplot(mapping = aes(x = preference)) +
  geom_bar()

Come for the functionality

… stay for the logo

  • The forcats package provides a suite of useful tools that solve common problems with factors
  • Factors are useful when you have true categorical data and you want to override the ordering of character vectors to improve display
  • They are also useful in modeling scenarios