First look at Palmer Penguins (Complete)
Data visualization and transformation
Data Science with R
Introduction
How do bill sizes of penguins vary across species? And what happens if we don’t take species into consideration?
Packages
We will use the tidyverse packages for data wrangling and visualization and the palmerpenguins package for the data.
Data
The dataset we will visualize is called penguins. Let’s glimpse() at it.
glimpse(penguins)Rows: 344
Columns: 8
$ species <fct> Adelie, Adelie, Adelie, Adelie, Adelie, Adelie, Adel…
$ island <fct> Torgersen, Torgersen, Torgersen, Torgersen, Torgerse…
$ bill_length_mm <dbl> 39.1, 39.5, 40.3, NA, 36.7, 39.3, 38.9, 39.2, 34.1, …
$ bill_depth_mm <dbl> 18.7, 17.4, 18.0, NA, 19.3, 20.6, 17.8, 19.6, 18.1, …
$ flipper_length_mm <int> 181, 186, 195, NA, 193, 190, 181, 195, 193, 190, 186…
$ body_mass_g <int> 3750, 3800, 3250, NA, 3450, 3650, 3625, 4675, 3475, …
$ sex <fct> male, female, female, NA, female, male, female, male…
$ year <int> 2007, 2007, 2007, 2007, 2007, 2007, 2007, 2007, 2007…Penguin bills
- Create a scatterplot of
bill_depth_mmvs.bill_length_mms ofpenguins. Overlay a line of best fit. Describe the relationship between the two variables.
ggplot(penguins, aes(x = bill_length_mm, y = bill_depth_mm)) +
  geom_point() +
  geom_smooth(method = "lm", se = FALSE)
`geom_smooth()` using formula = 'y ~ x'Warning: Removed 2 rows containing non-finite outside the scale range
(`stat_smooth()`).Warning: Removed 2 rows containing missing values or values outside the scale range
(`geom_point()`).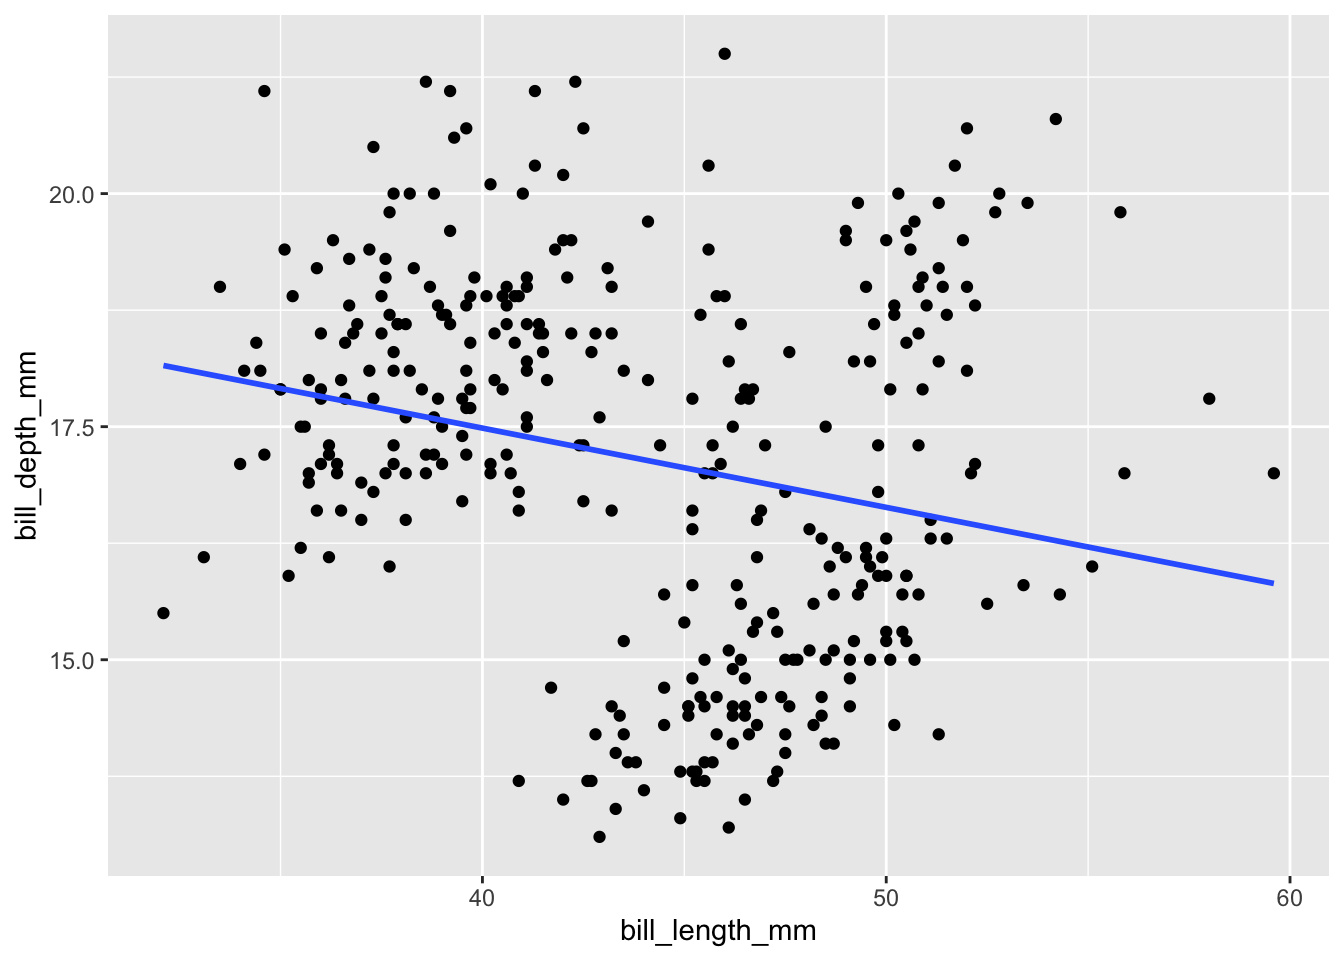
There is a negative relationship between bill depth and bill length. The relationship is somewhat weak and linear.
- Create a scatterplot of
bill_depth_mmvs.bill_length_mms ofpenguins, colored byspecies. Overlay a line of best fit. Describe the relationship between the two variables for each of the species.
ggplot(penguins, aes(x = bill_length_mm, y = bill_depth_mm, color = species)) +
  geom_point() +
  geom_smooth(method = "lm", se = FALSE)
`geom_smooth()` using formula = 'y ~ x'Warning: Removed 2 rows containing non-finite outside the scale range
(`stat_smooth()`).Warning: Removed 2 rows containing missing values or values outside the scale range
(`geom_point()`).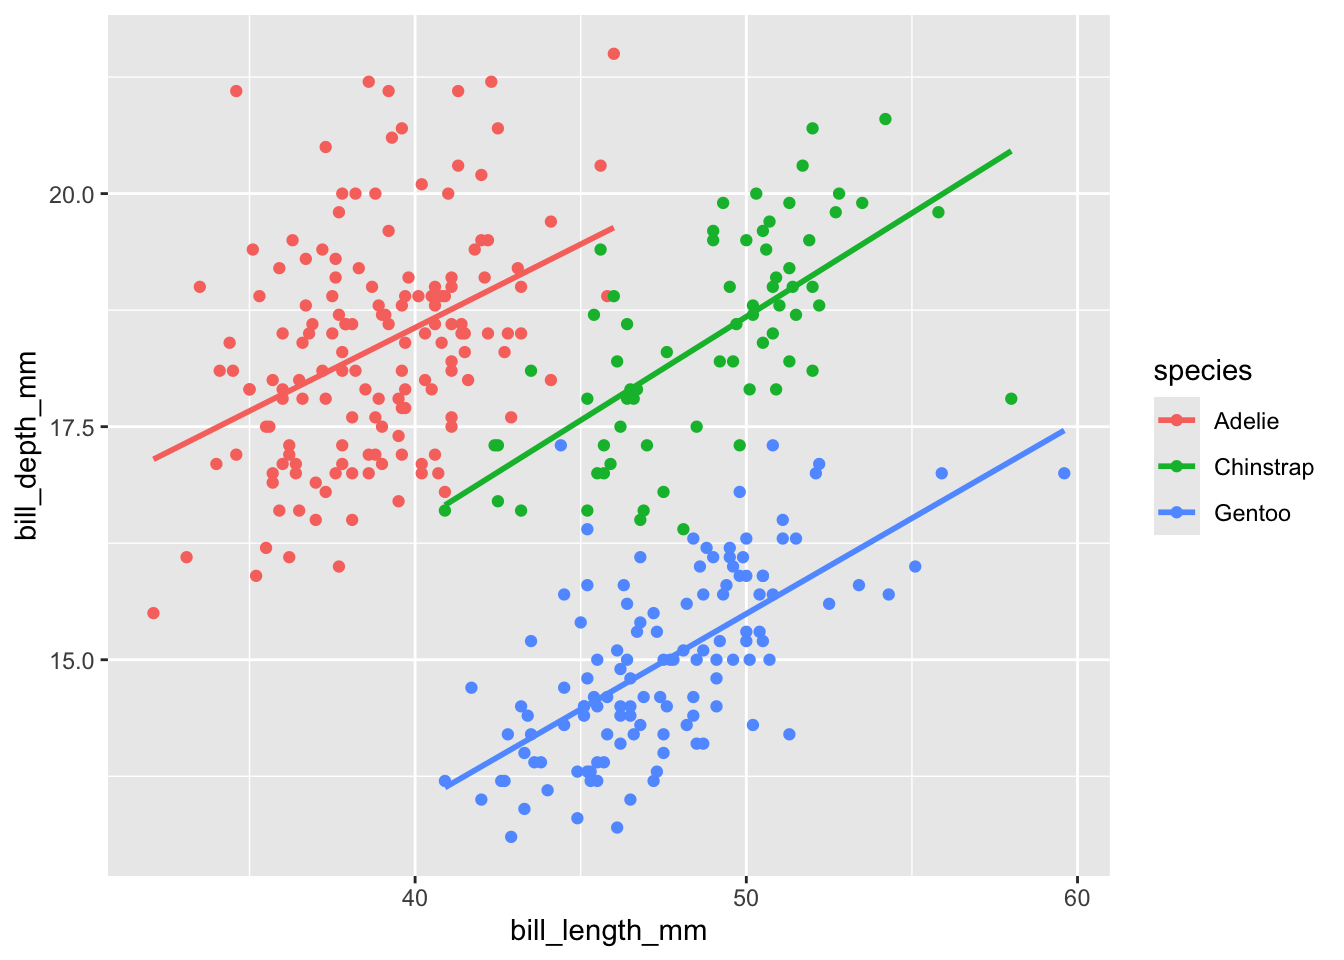
There is a positive relationship between bill depth and bill length for each of the three species. The relationships are moderately strong and linear.
- Reflect on the seemingly contradictory findings from the two visualizations you’ve created. Which one do you believe more, and why?
I believe the second one more, we should be considering species when analyzing the relationship between bill depth and bill length for penguins.