Starwars characters (Complete)

Data visualization and transformation
Data Science with R

Introduction

You might not be a Star Wars fan, but you’ve probably heard of the movie franchise!

Packages

We will use the tidyverse packages for data wrangling and for the data.

Data

The dataset we will explore is called starwars.

Star Wars characters

Exercise 1

Glimpse at the starwars data frame.

glimpse(starwars)
Rows: 87
Columns: 14
$ name       <chr> "Luke Skywalker", "C-3PO", "R2-D2", "Darth Vader", "Leia Or…
$ height     <int> 172, 167, 96, 202, 150, 178, 165, 97, 183, 182, 188, 180, 2…
$ mass       <dbl> 77.0, 75.0, 32.0, 136.0, 49.0, 120.0, 75.0, 32.0, 84.0, 77.…
$ hair_color <chr> "blond", NA, NA, "none", "brown", "brown, grey", "brown", N…
$ skin_color <chr> "fair", "gold", "white, blue", "white", "light", "light", "…
$ eye_color  <chr> "blue", "yellow", "red", "yellow", "brown", "blue", "blue",…
$ birth_year <dbl> 19.0, 112.0, 33.0, 41.9, 19.0, 52.0, 47.0, NA, 24.0, 57.0, …
$ sex        <chr> "male", "none", "none", "male", "female", "male", "female",…
$ gender     <chr> "masculine", "masculine", "masculine", "masculine", "femini…
$ homeworld  <chr> "Tatooine", "Tatooine", "Naboo", "Tatooine", "Alderaan", "T…
$ species    <chr> "Human", "Droid", "Droid", "Human", "Human", "Human", "Huma…
$ films      <list> <"A New Hope", "The Empire Strikes Back", "Return of the J…
$ vehicles   <list> <"Snowspeeder", "Imperial Speeder Bike">, <>, <>, <>, "Imp…
$ starships  <list> <"X-wing", "Imperial shuttle">, <>, <>, "TIE Advanced x1",…
Exercise 2

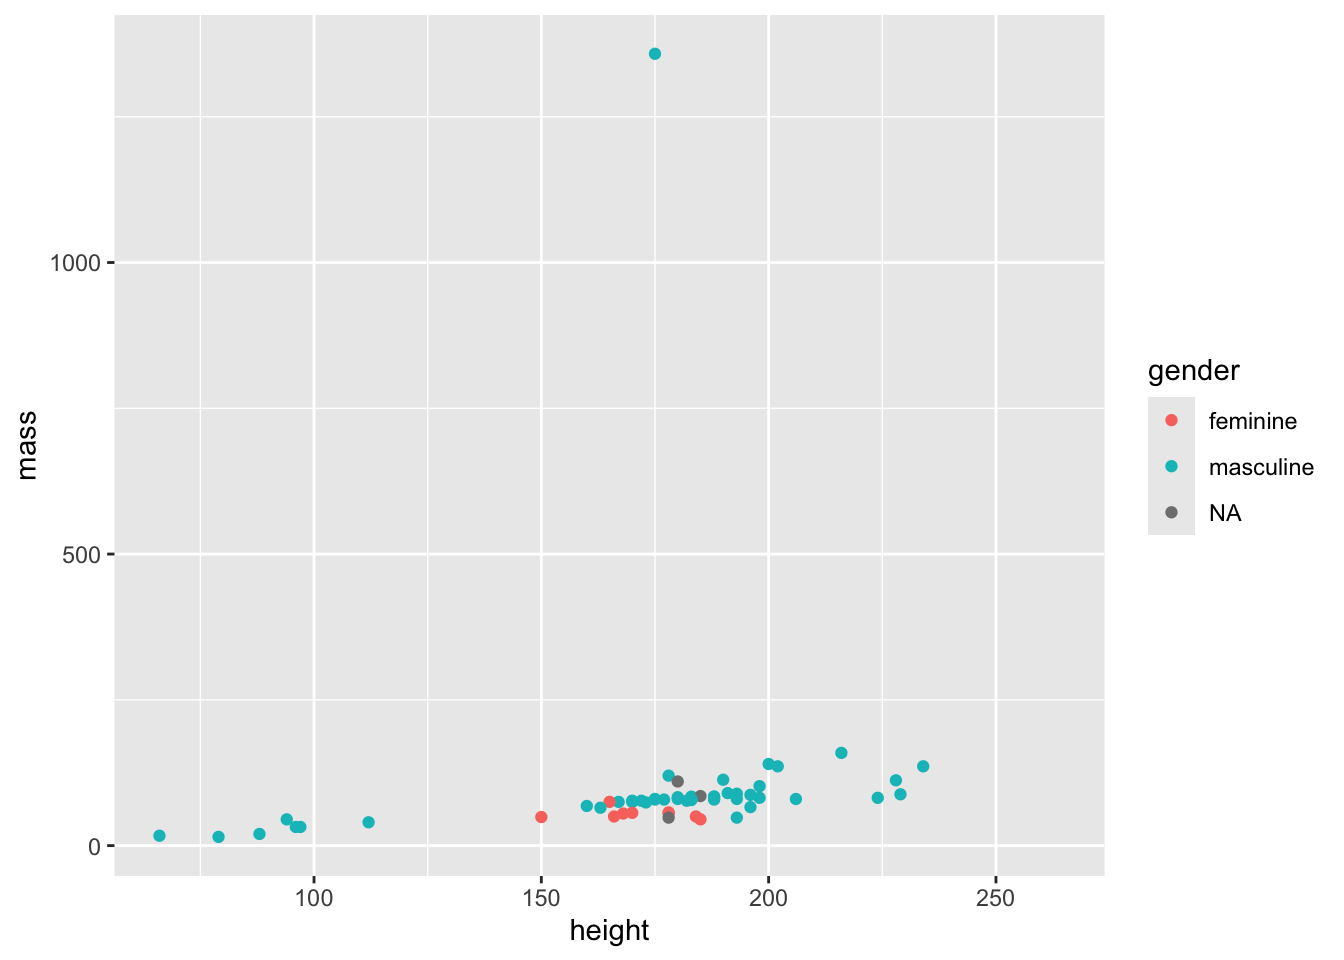
Modify the following plot to change the color of the points by gender.

ggplot(starwars, aes(x = height, y = mass, color = gender)) +
  geom_point()
Warning: Removed 28 rows containing missing values or values outside the scale range
(`geom_point()`).

Exercise 3

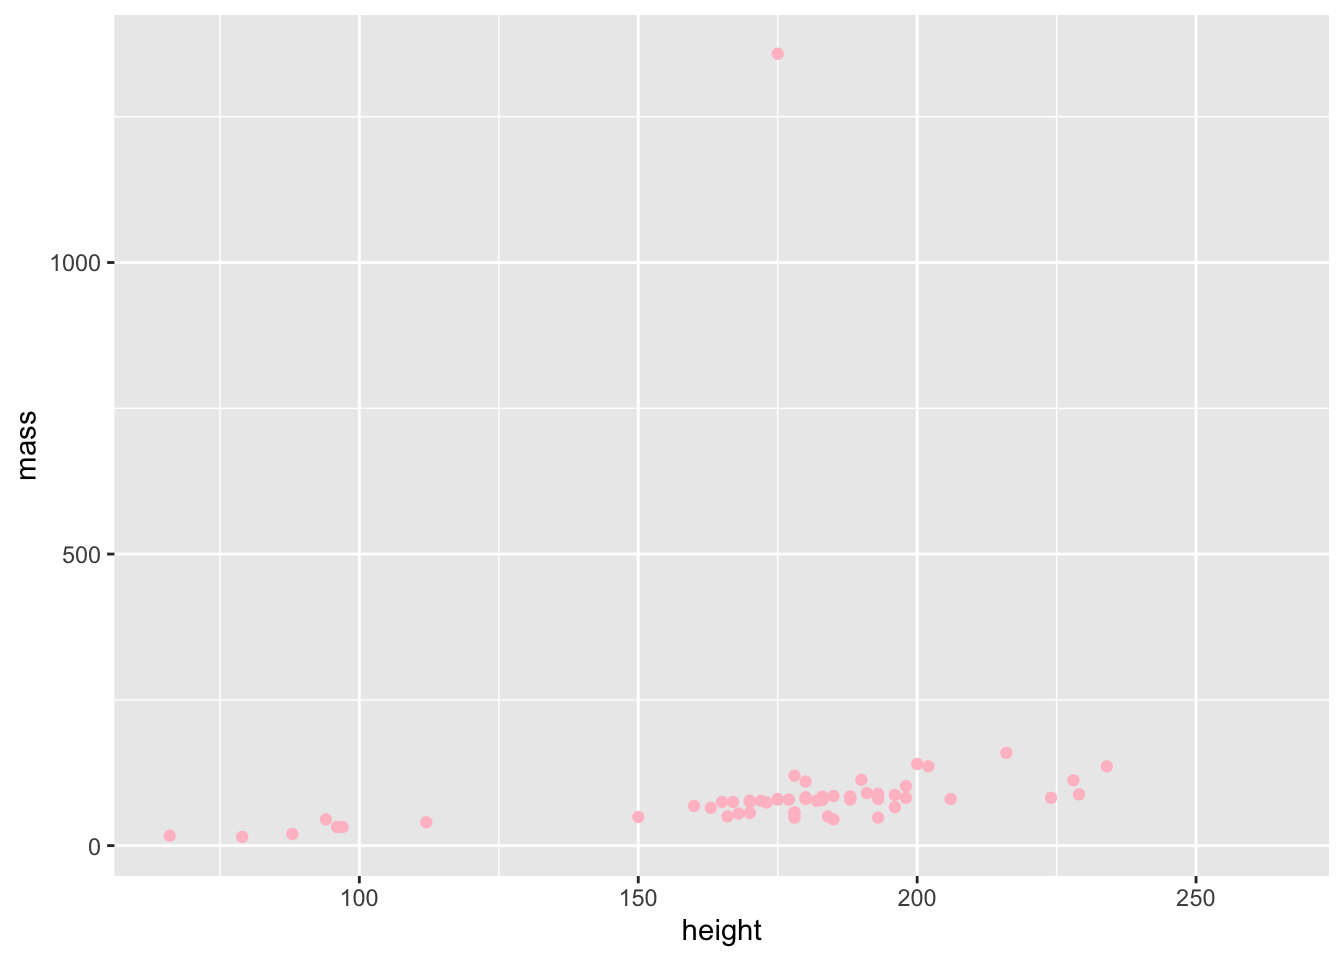
Modify the following plot to change the color of all points to "pink".

ggplot(starwars, aes(x = height, y = mass)) +
  geom_point(color = "pink")
Warning: Removed 28 rows containing missing values or values outside the scale range
(`geom_point()`).

Exercise 4

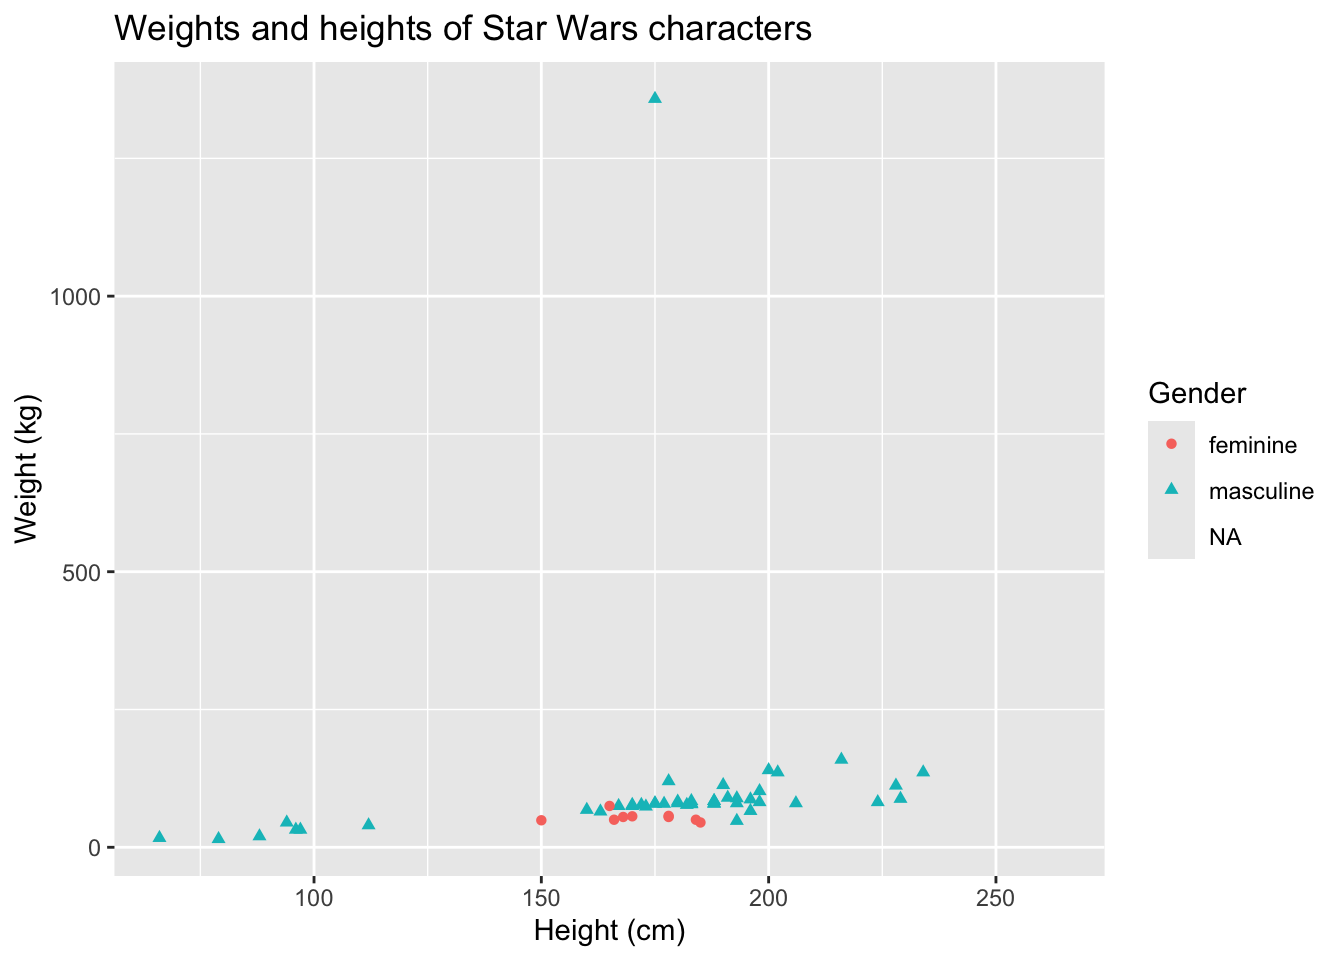
Add labels for title, x and y axes, and color of points.

ggplot(starwars, aes(x = height, y = mass, color = gender, shape = gender)) +
  geom_point() +
  labs(
    title = "Weights and heights of Star Wars characters",
    x = "Height (cm)",
    y = "Weight (kg)",
    color = "Gender",
    shape = "Gender"
  )
Warning: Removed 31 rows containing missing values or values outside the scale range
(`geom_point()`).

Exercise 5

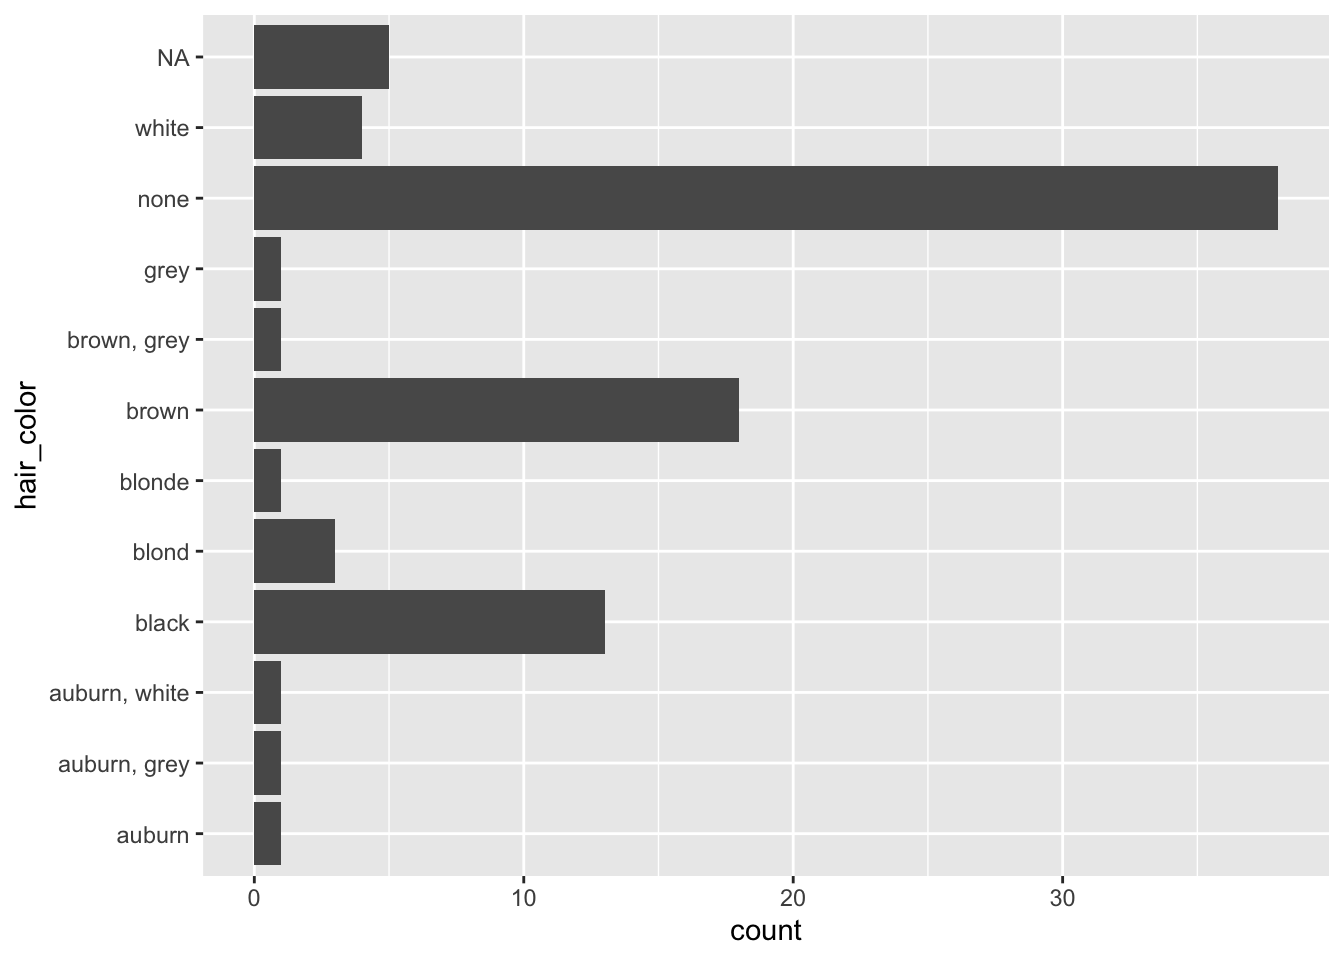
Pick a single categorical variable from the data set and make a bar plot of its distribution. Describe what you see in the plot.

Add description here.

ggplot(starwars, aes(y = hair_color)) +
  geom_bar()

Exercise 6

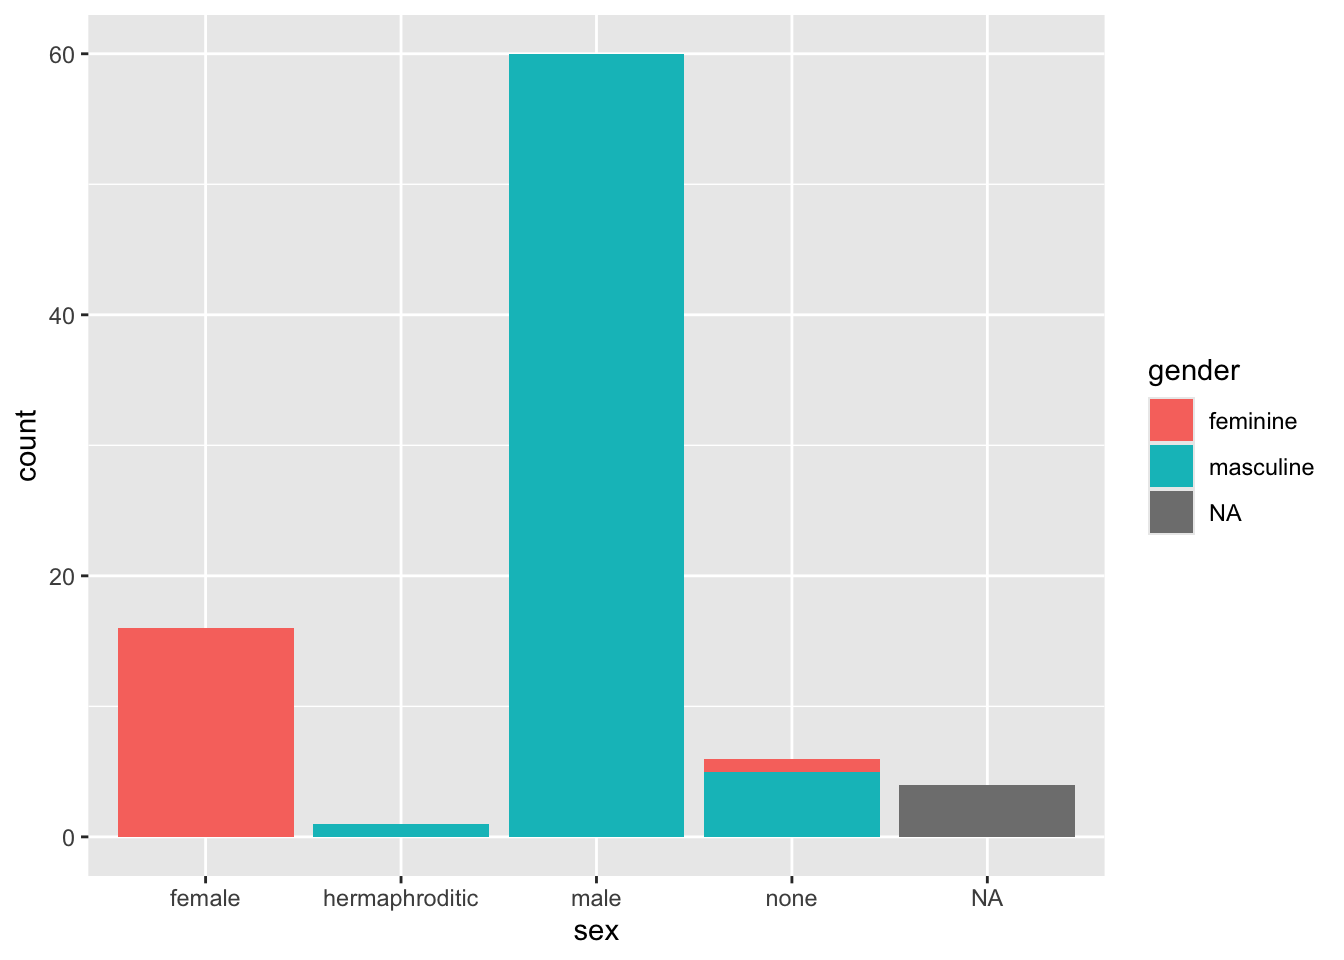
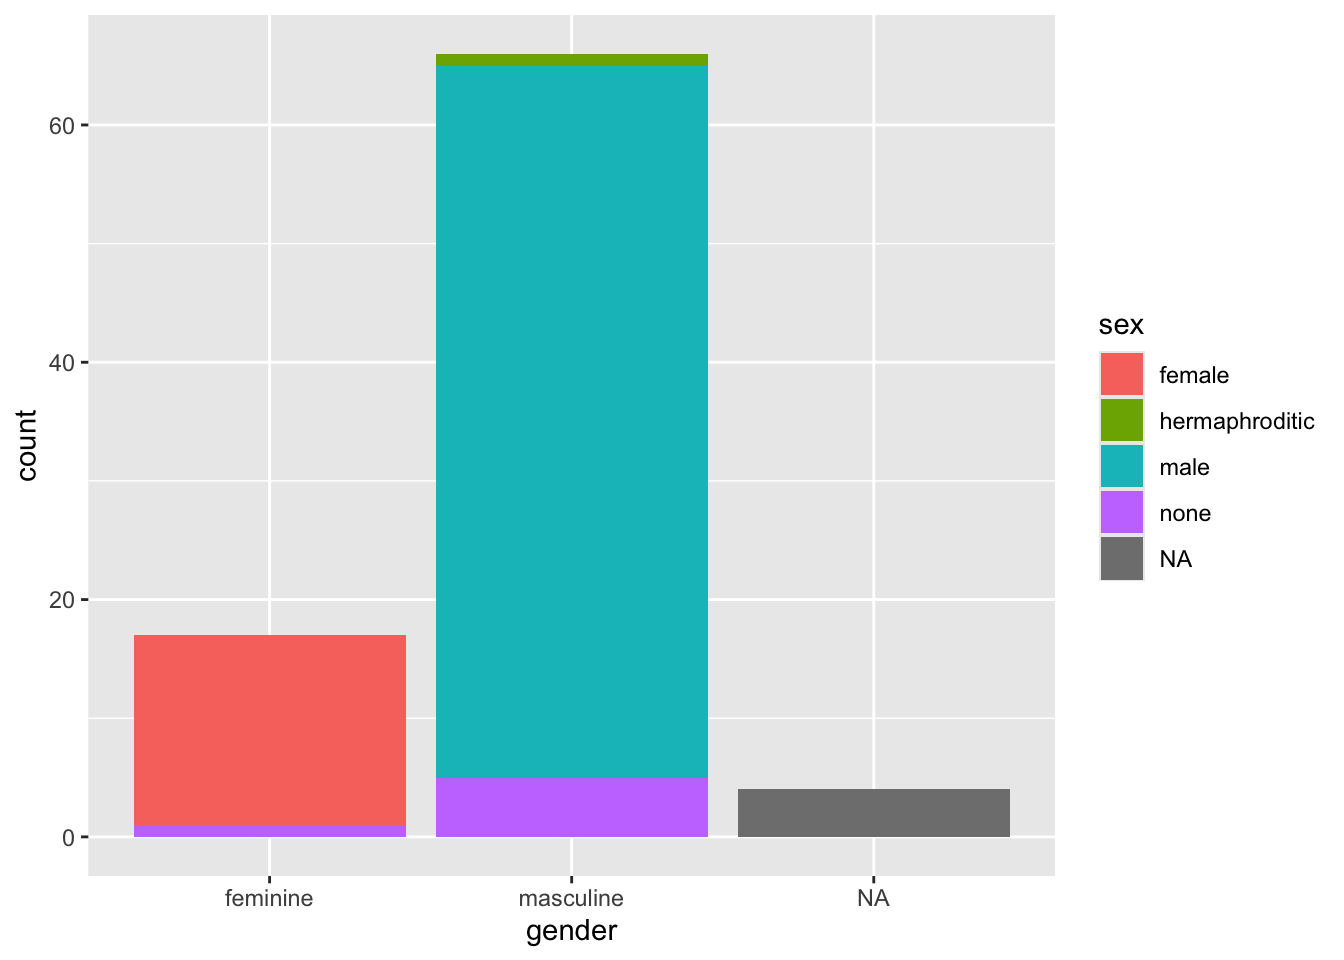
Pick two categorical variables and make a visualization to visualize the relationship between the these variables. Along with your code and output, provide an interpretation of the visualization.

Add interpretation here.

ggplot(starwars, aes(x = sex, fill = gender)) +
  geom_bar()

ggplot(starwars, aes(x = gender, fill = sex)) +
  geom_bar()

Exercise 7

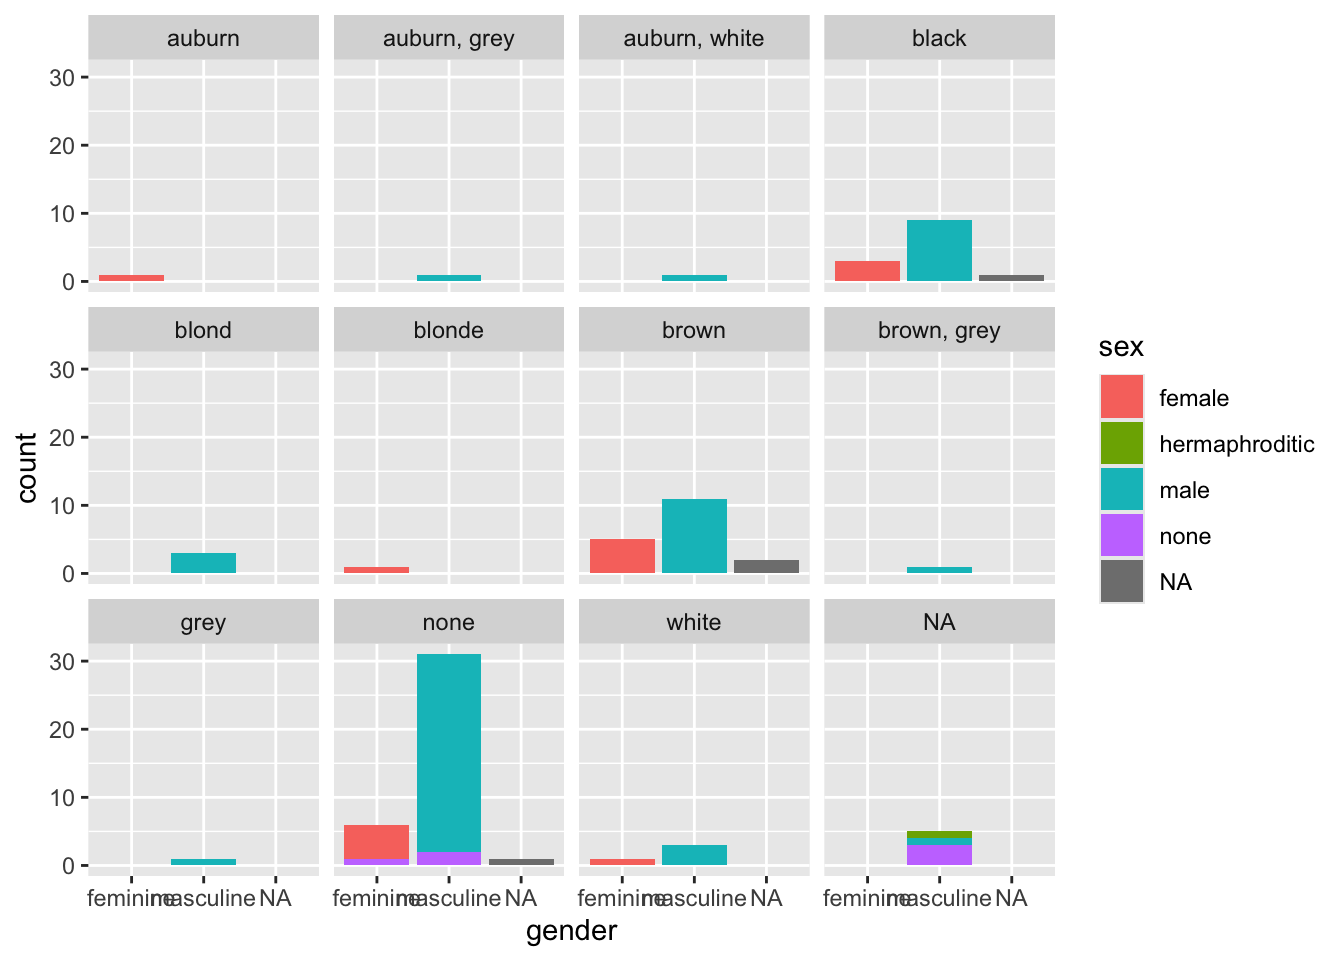
Pick three categorical variables and make a visualization to visualize the relationship between the these variables. Along with your code and output, provide an interpretation of the visualization.

Add interpretation here.

ggplot(starwars, aes(x = gender, fill = sex)) +
  geom_bar() +
  facet_wrap(~hair_color)