Meet the toolkit: Quarto


Data visualization and transformation

Data Science with R

Learning goals

By the end of the course, you will be able to…

  • gain insights from data

  • gain insights from data, using modern programming tools and techniques

  • gain insights from data, using modern programming tools and techniques, reproducibly with literate programming

  • gain insights from data, using modern programming tools and techniques, reproducibly with literate programming and version control

Reproducible data analysis

Reproducibility checklist

What does it mean for a data analysis to be “reproducible”?


Short-term goals:

  • Tables and figures must be reproducible from the code and data
  • The code should actually do what you think it does
  • In addition to what was done, it should be clear why it was done

Long-term goals:

  • The code should be usable for other data
  • The code should be extendable to do other things

Toolkit for reproducibility

  • Scriptability → R

  • Literate programming (code, narrative, output in one place) → Quarto

  • Version control → Git / GitHub

Quarto

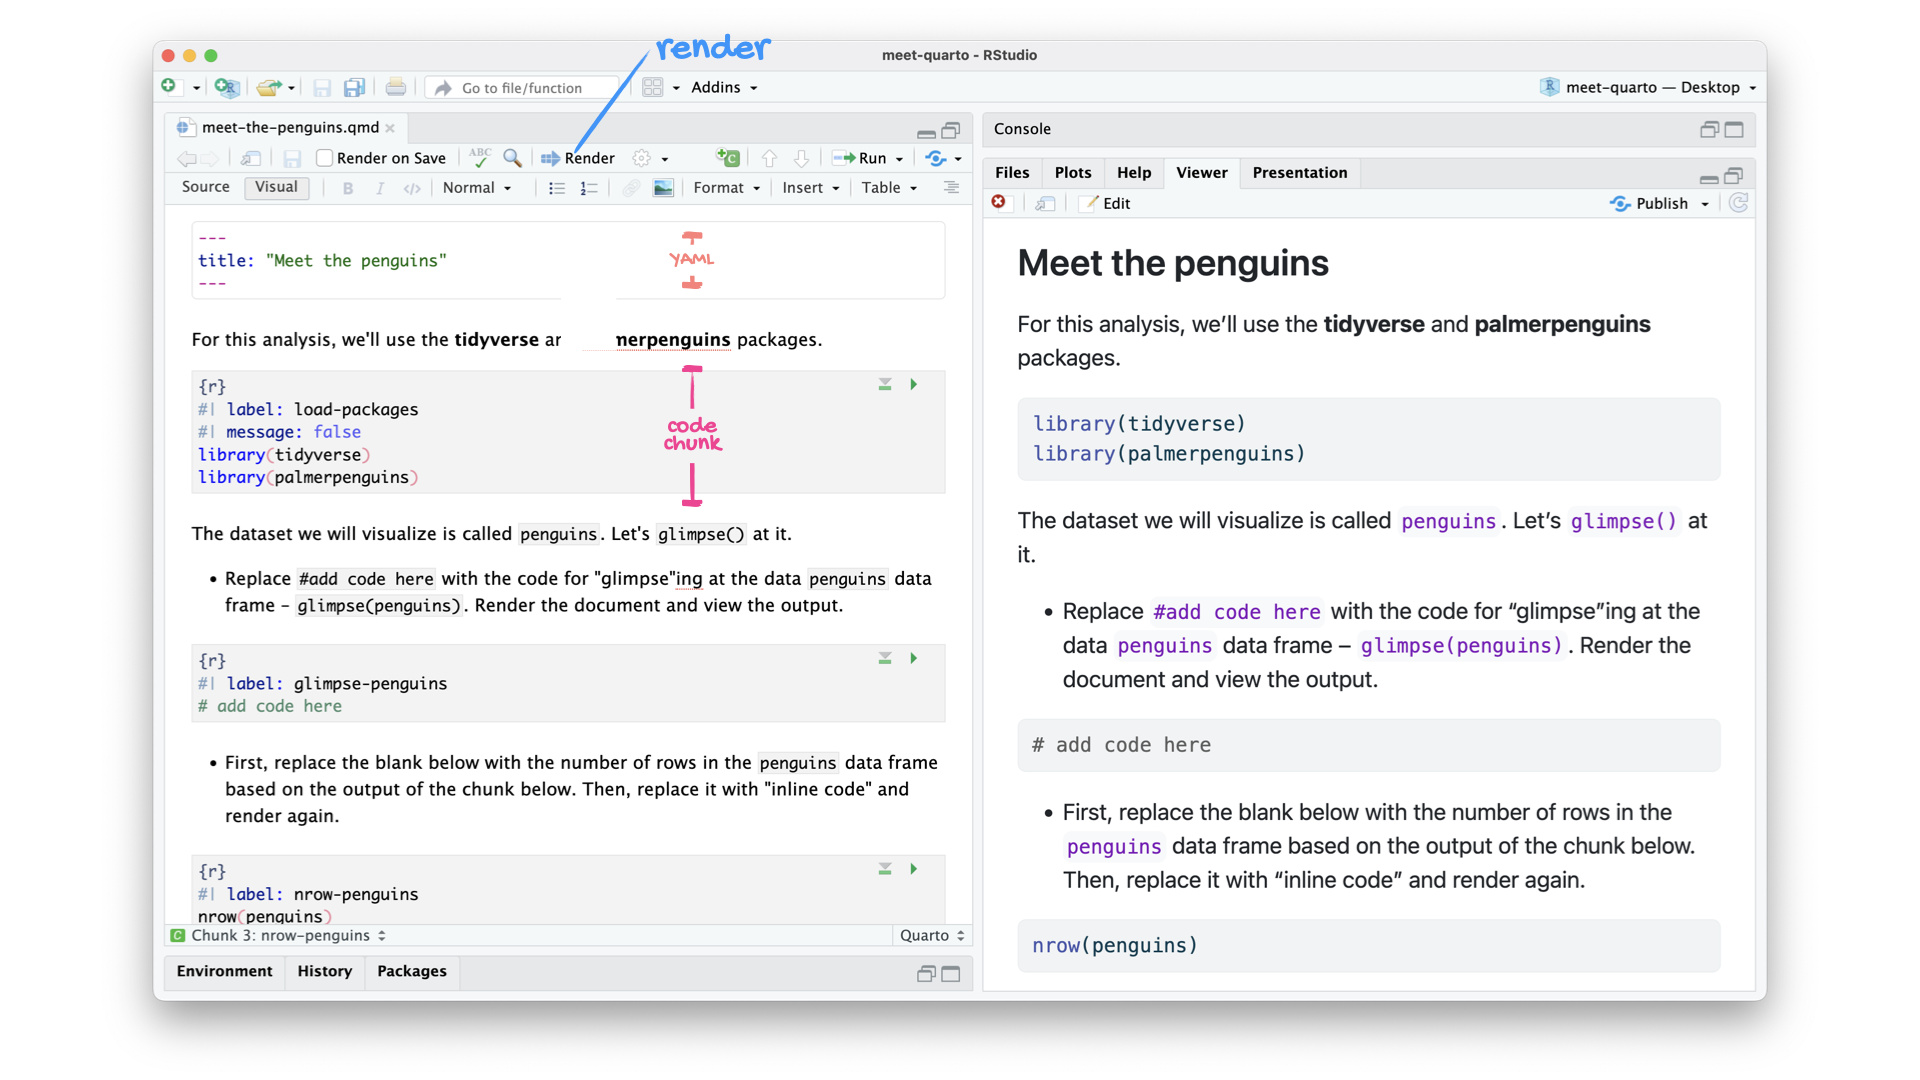
  • Open-source scientific and technical publishing system
  • Fully reproducible reports – each time you render the analysis is ran from the beginning
  • Code goes in chunks narrative goes outside of chunks
  • A visual editor for a familiar, Google Docs/MS Word-like editing experience

Let’s take a tour of

Tour recap: Quarto

Environments

Important

The environment of your Quarto document is separate from the Console!

Remember this, and expect it to bite you a few times as you’re learning to work with Quarto!

How will we use Quarto?

  • Every code along is a Quarto document

  • You’ll always have a template Quarto document to start with

  • The amount of scaffolding in the template will decrease over the semester