Quantifying uncertainty
Modeling and inference
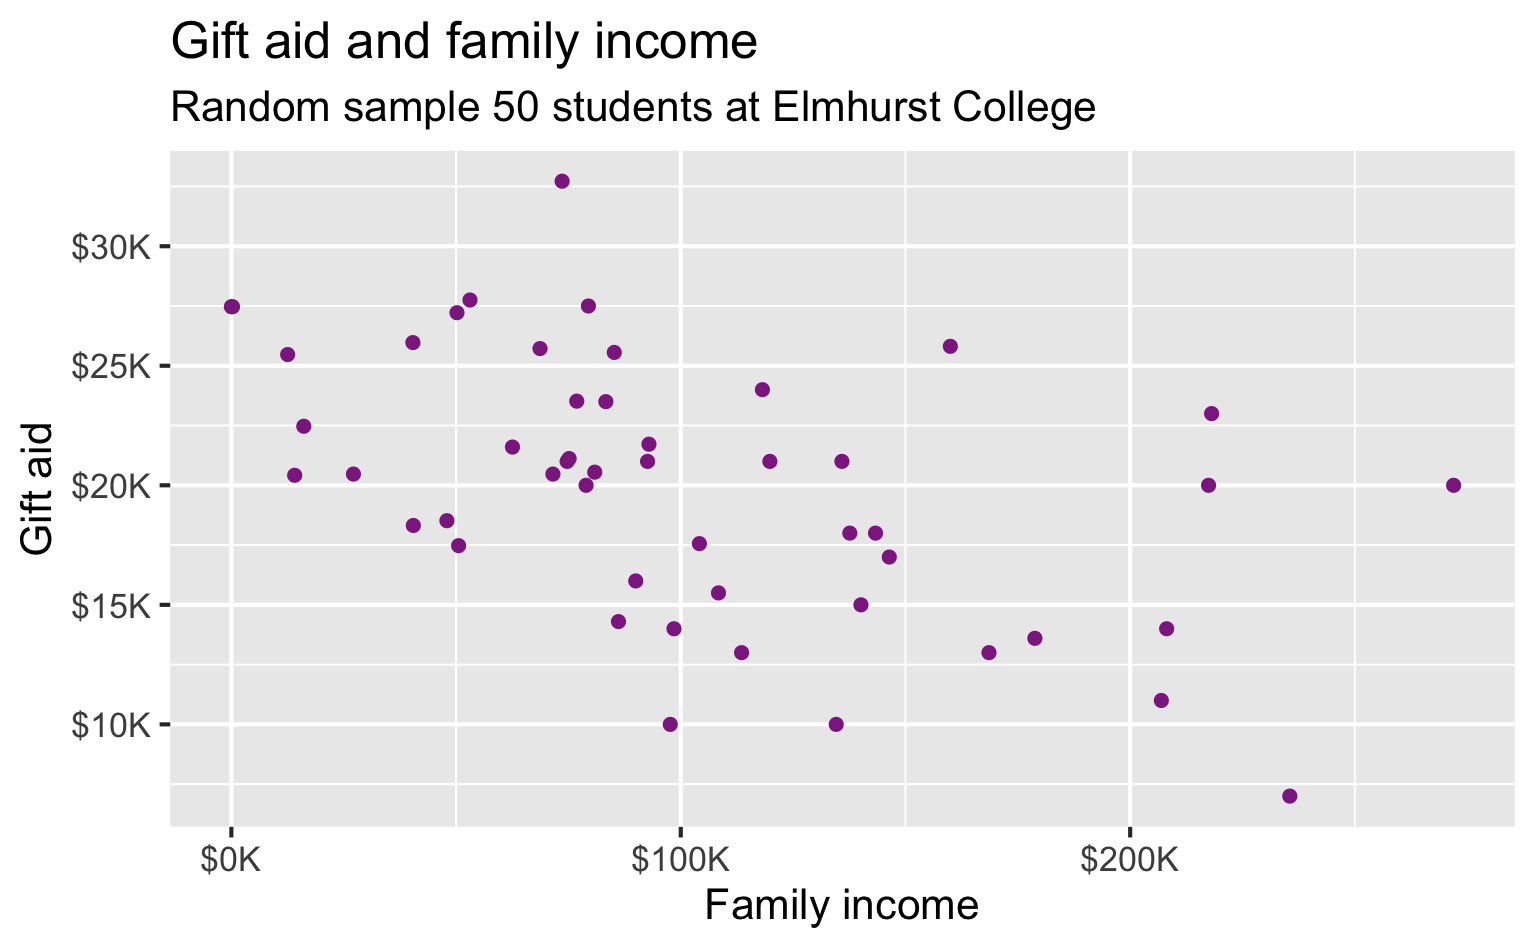
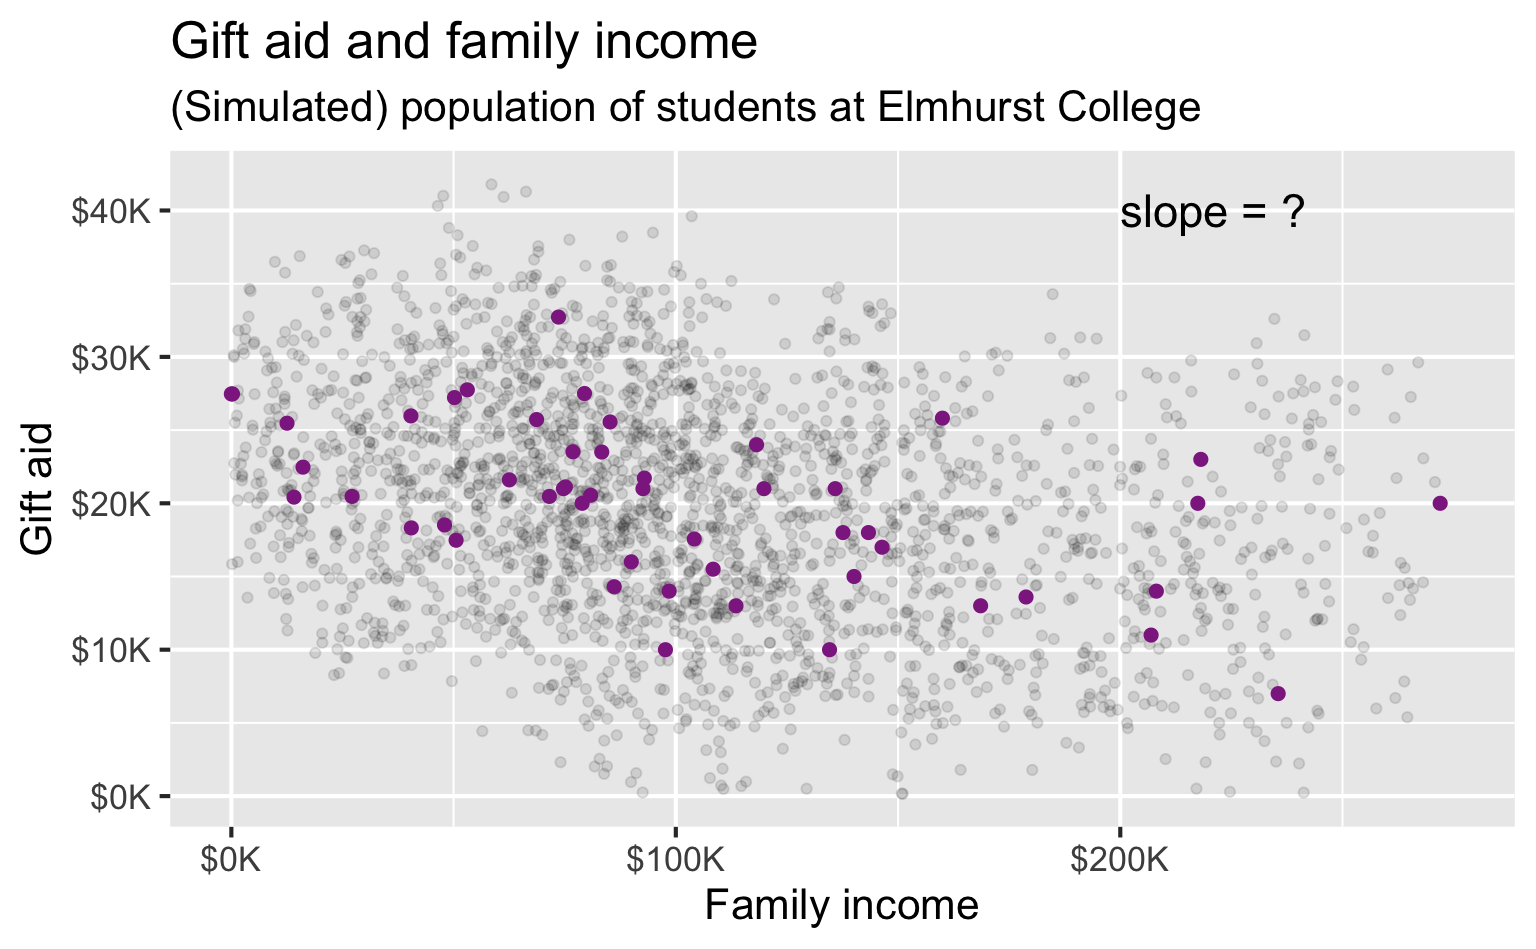
Data
- Family income and gift aid data from a random sample of fifty students in the freshman class of Elmhurst College in Illinois, USA
- Gift aid is financial aid that doesn’t need to be paid back, unlike loans
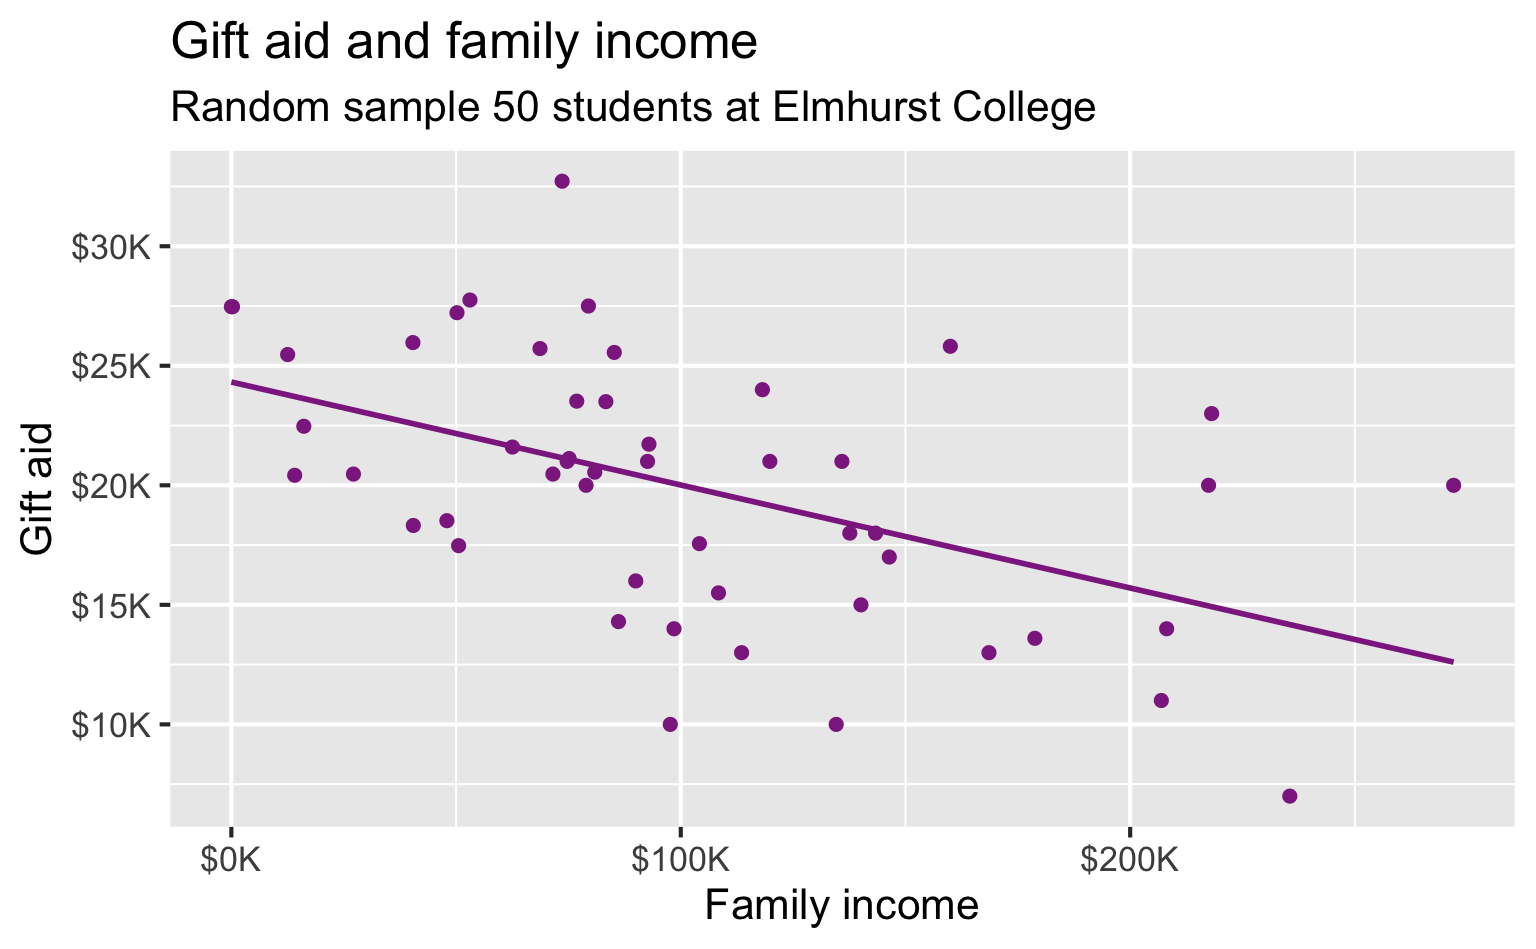
Linear model

Interpreting the slope
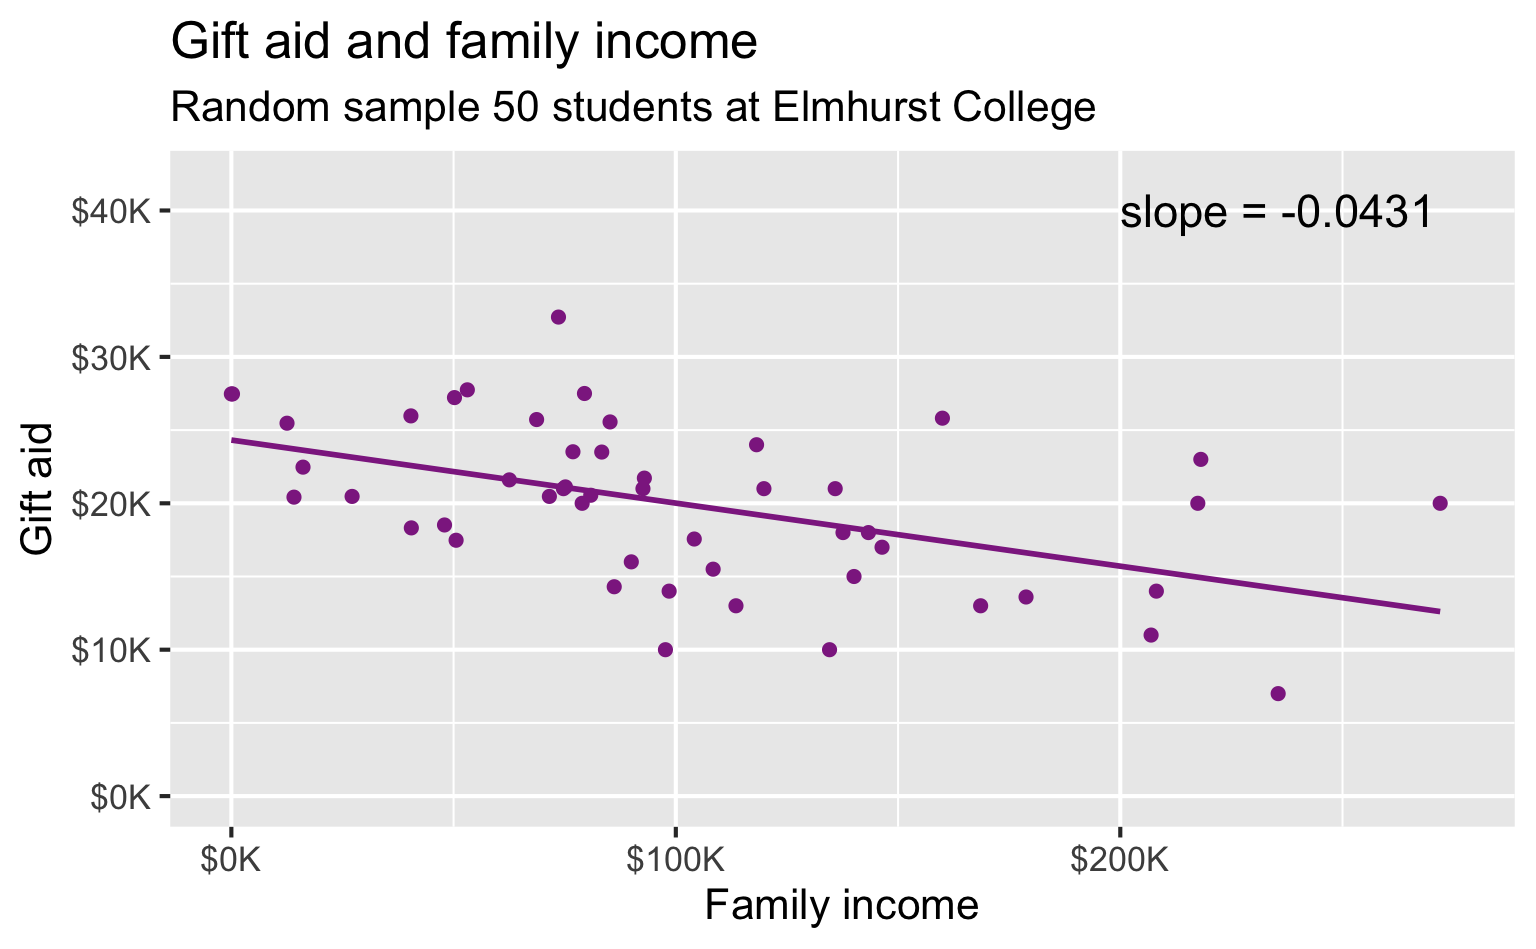
# A tibble: 2 × 5
  term          estimate std.error statistic  p.value
  <chr>            <dbl>     <dbl>     <dbl>    <dbl>
1 (Intercept)    24.3       1.29       18.8  8.28e-24
2 family_income -0.0431 0.0108 -3.98 2.29e- 4For each additional $1,000 of family income, we would expect students to receive a net difference of 1,000 * (-0.0431) = -$43.10 in aid on average, i.e. $43.10 less in gift aid, on average.
Statistical inference
- Statistical inference provides methods and tools so we can use the single observed sample to make valid statements (inferences) about the population it comes from.
- For our inferences to be valid, the sample should be random and representative of the population we’re interested in.

Spear or net?
If you want to catch a fish, do you prefer a spear or a net?


Observed sample
Bootstrap population
Generated assuming there are more students like the ones in the observed sample…
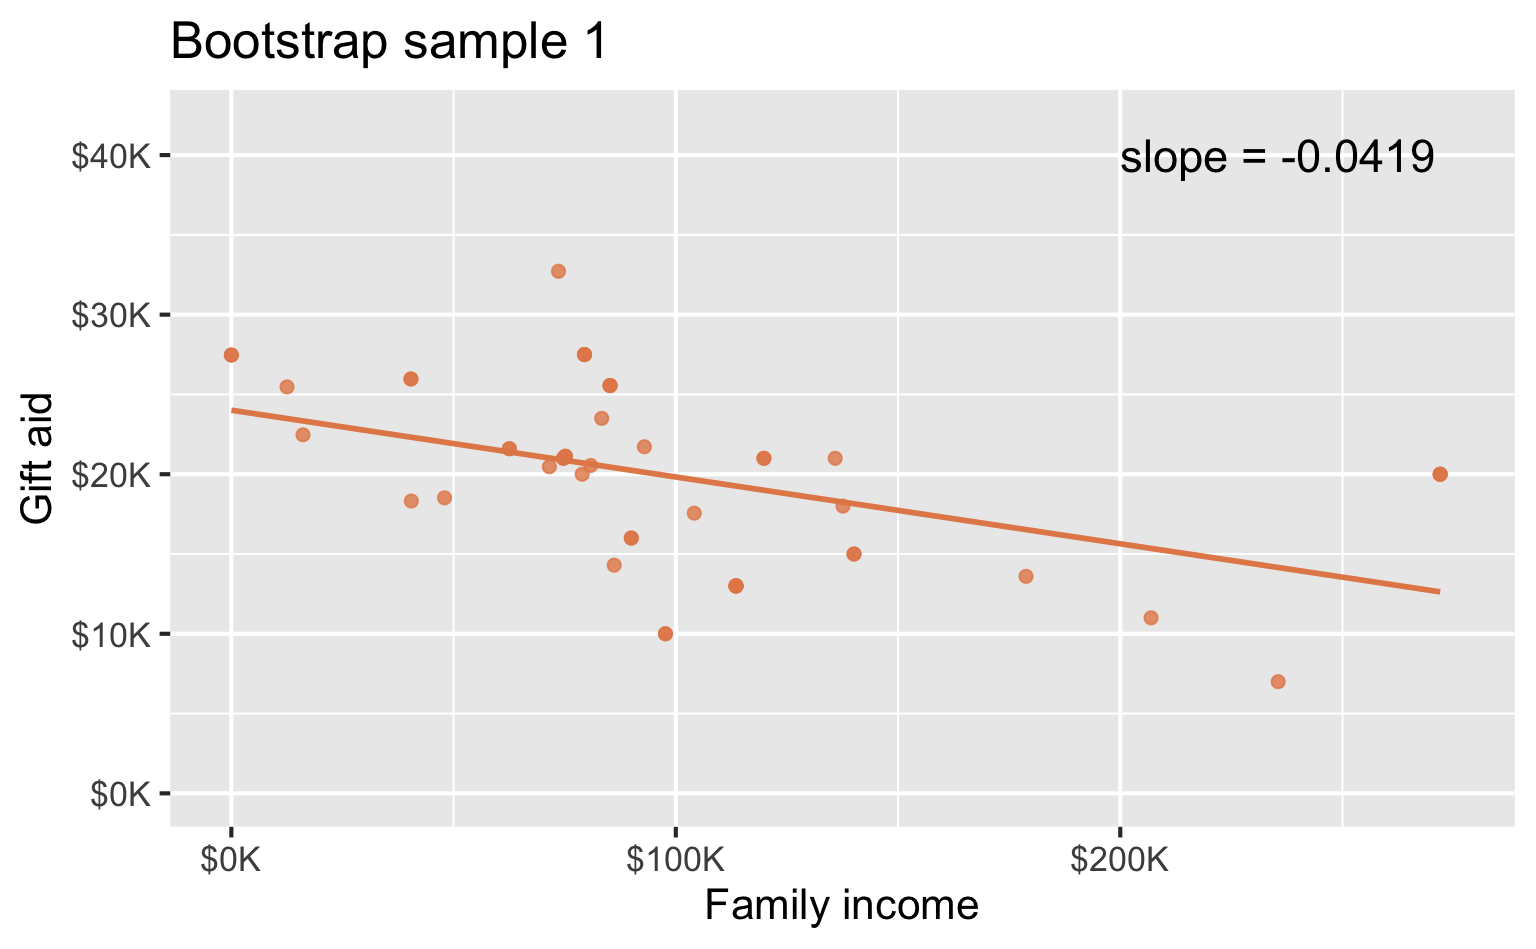
Bootstrap sample 1
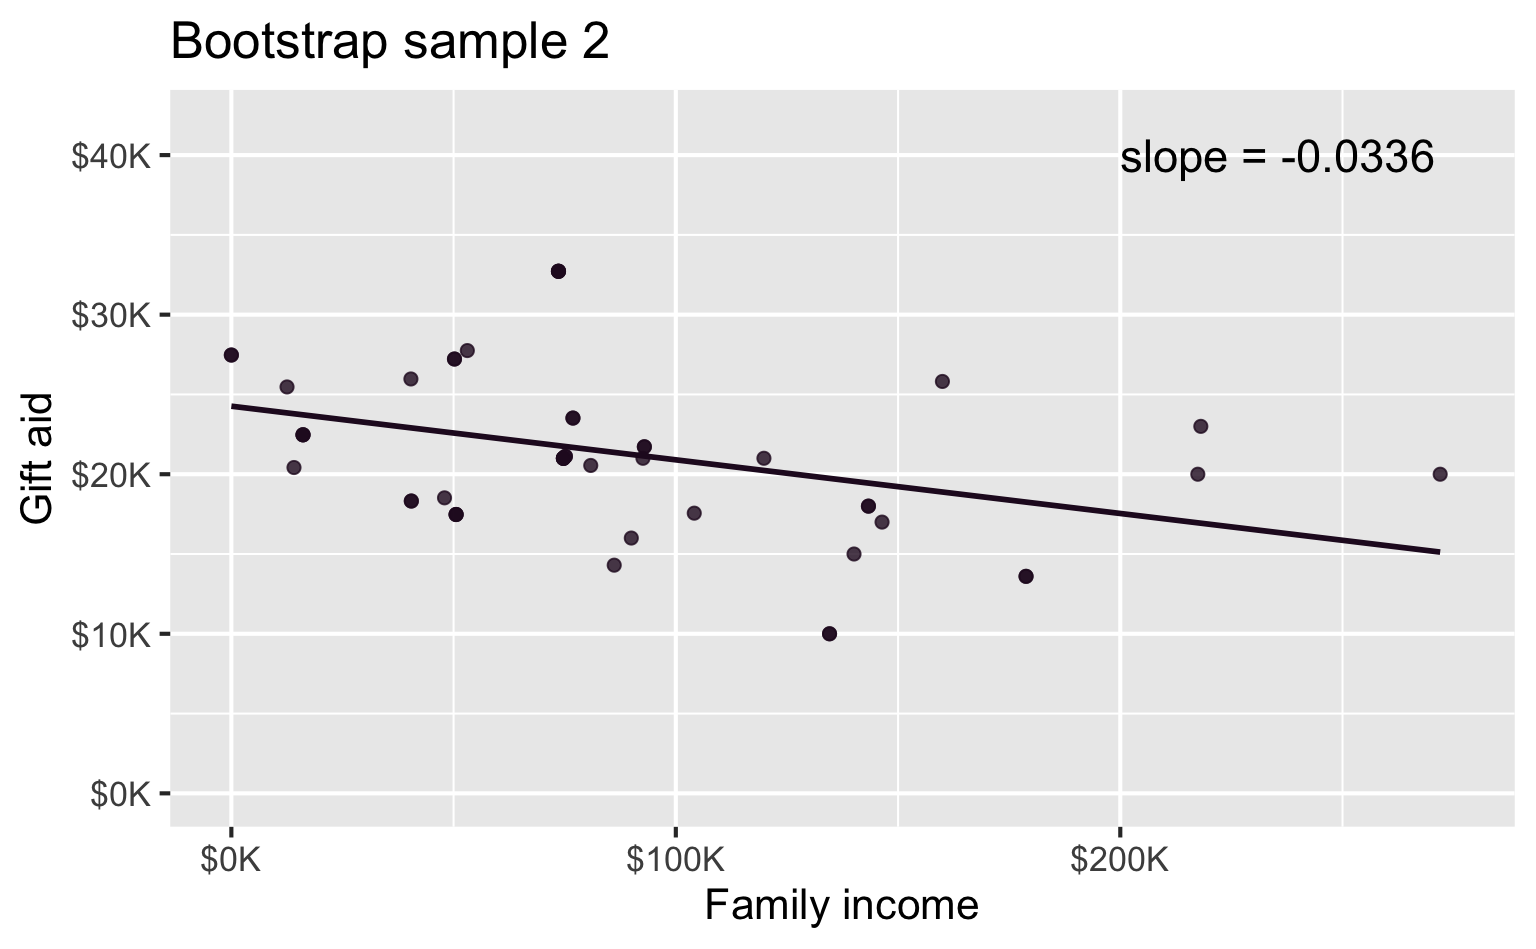
Bootstrap sample 2
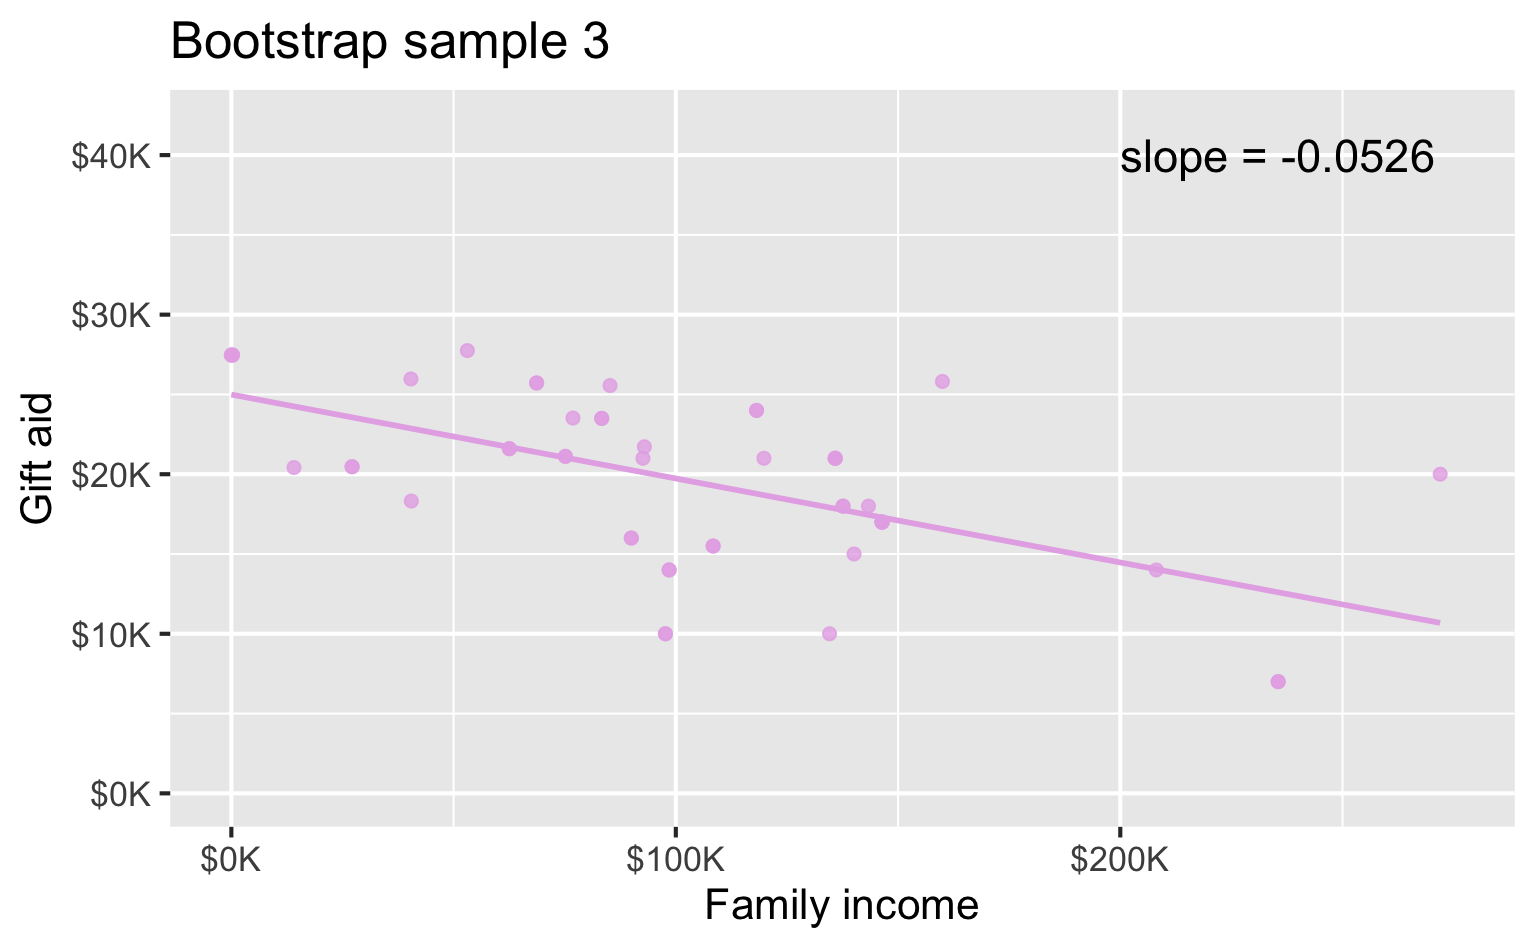
Bootstrap sample 3
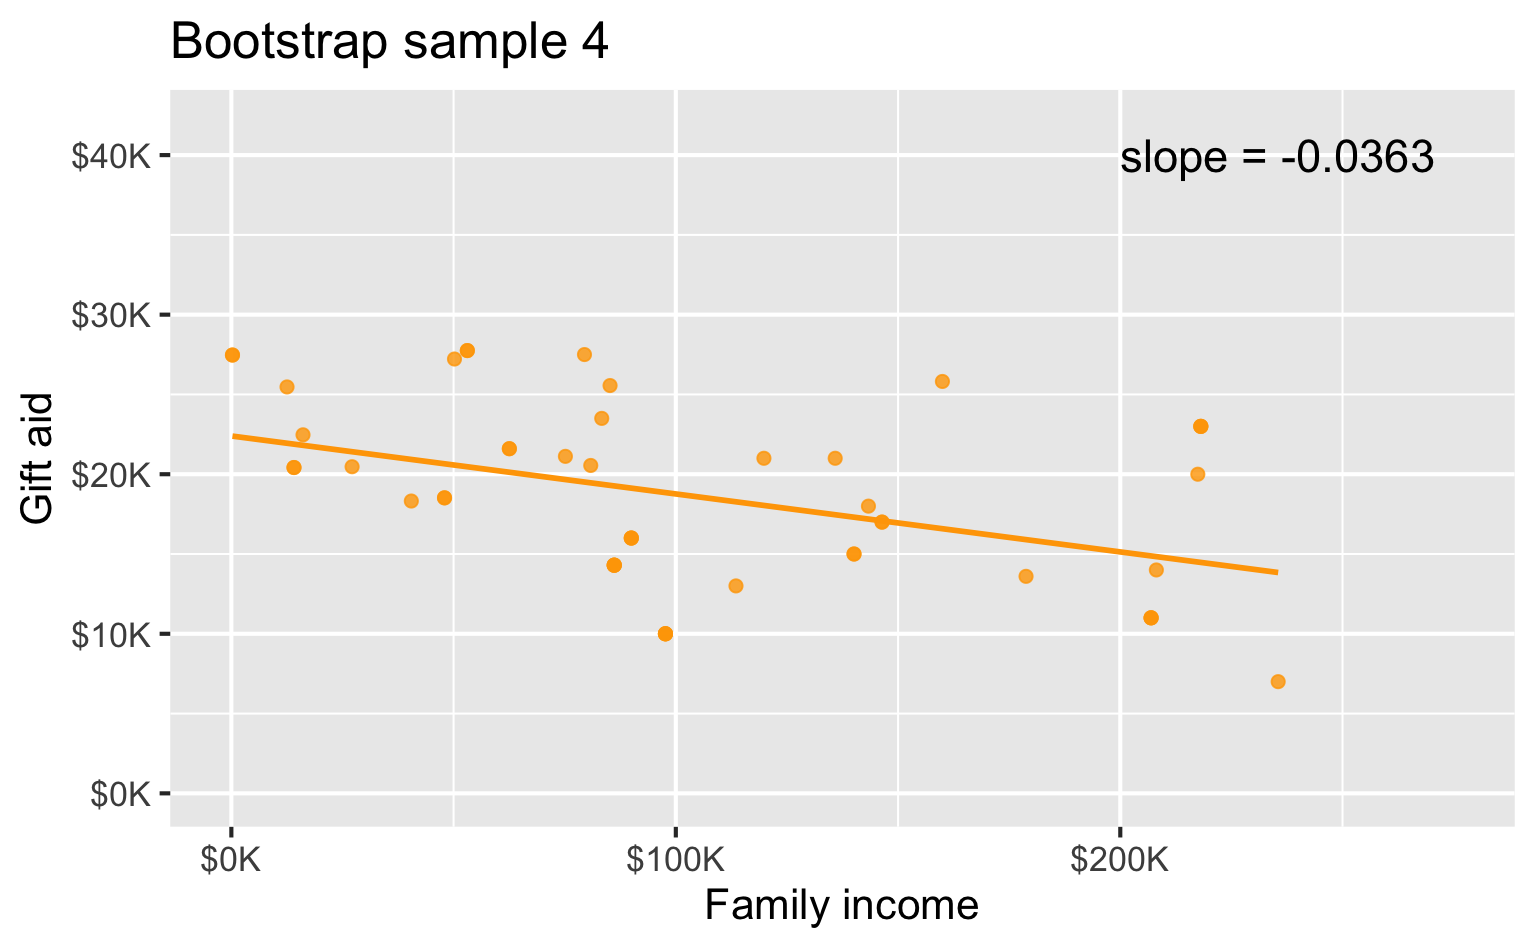
Bootstrap sample 4
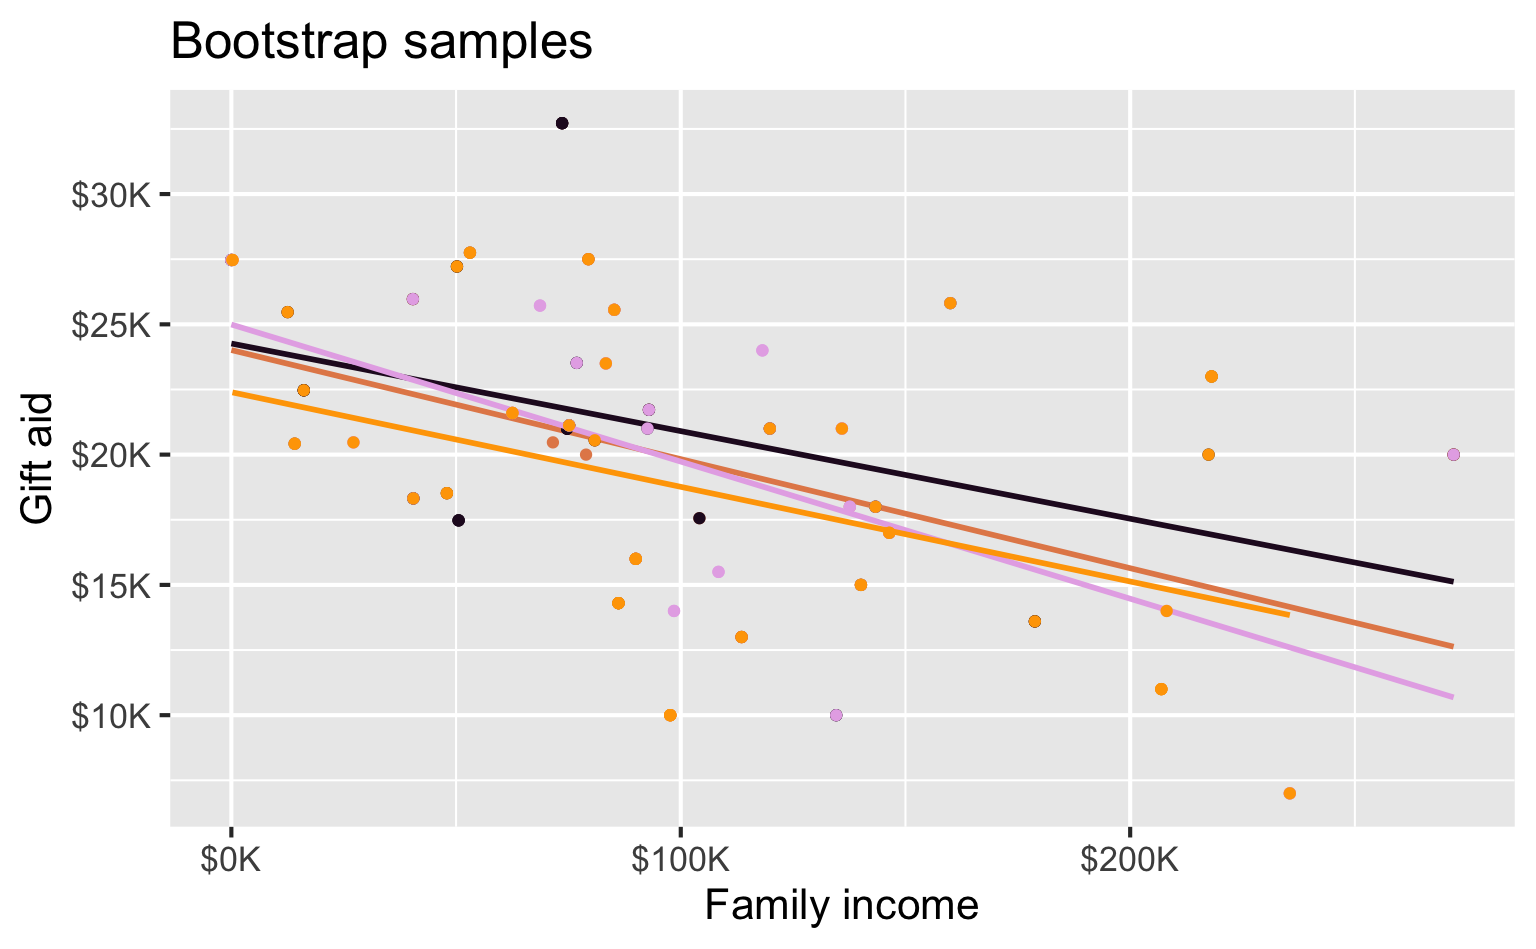
Bootstrap samples 1 - 4
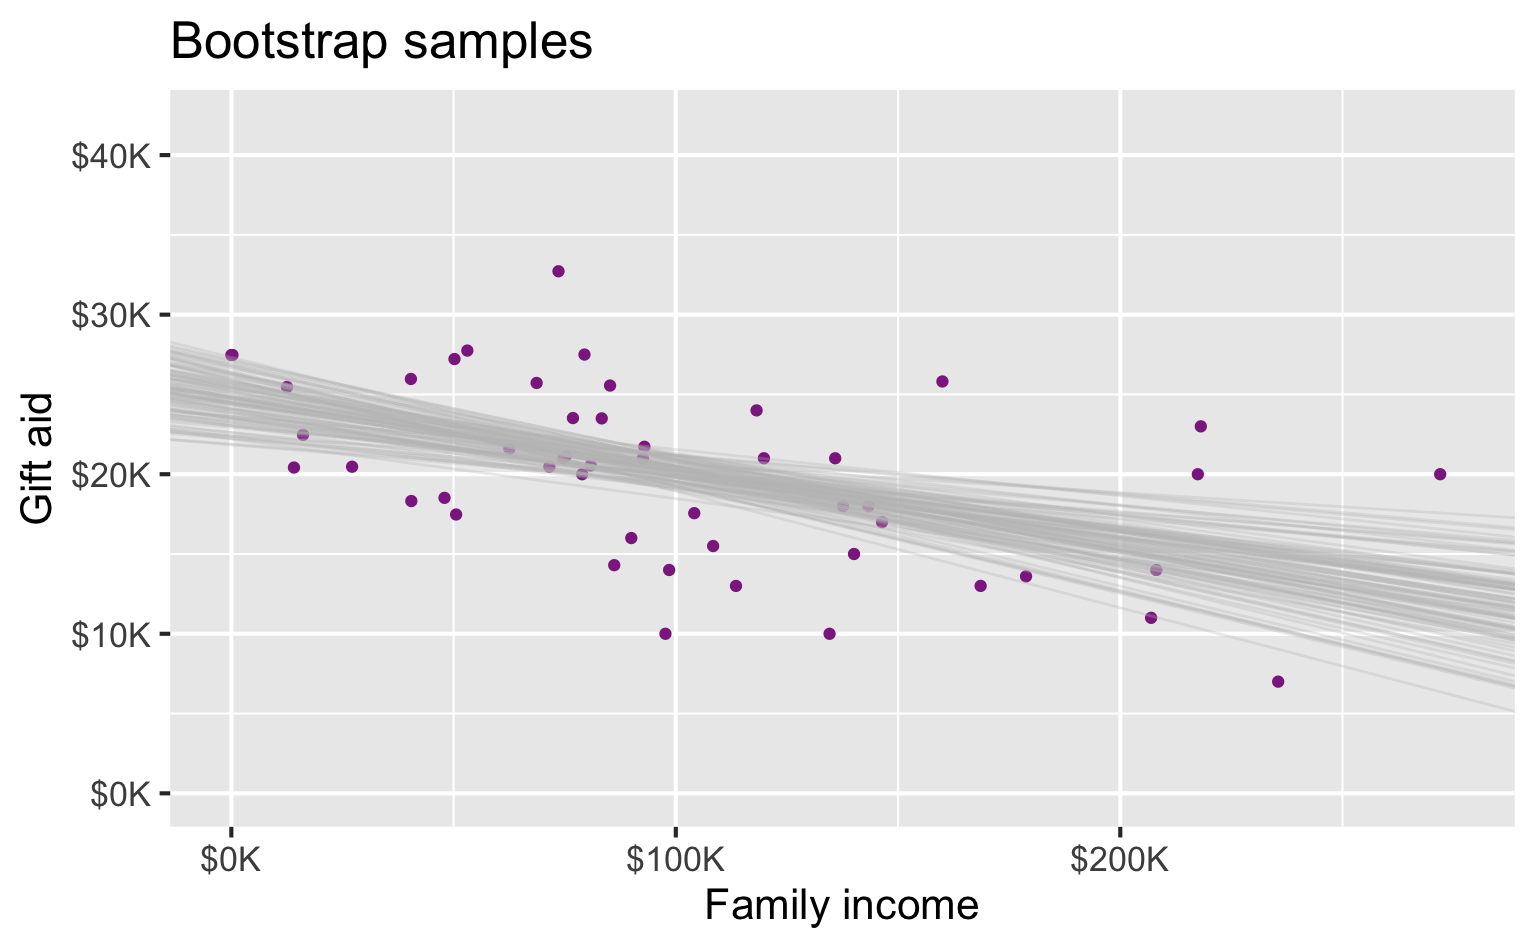
Many many samples…
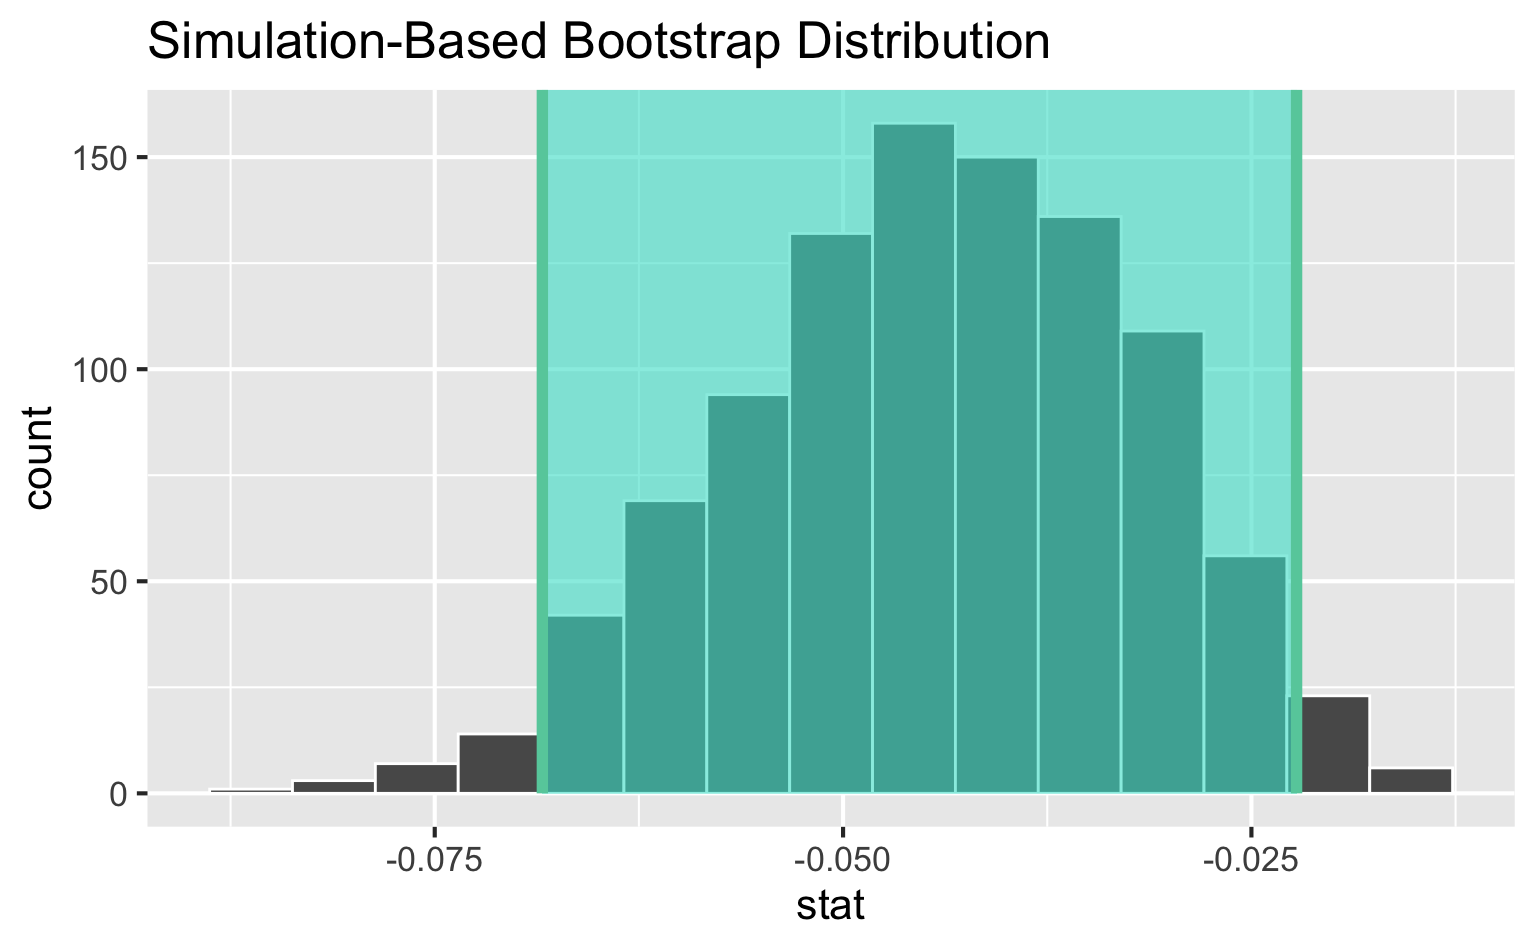
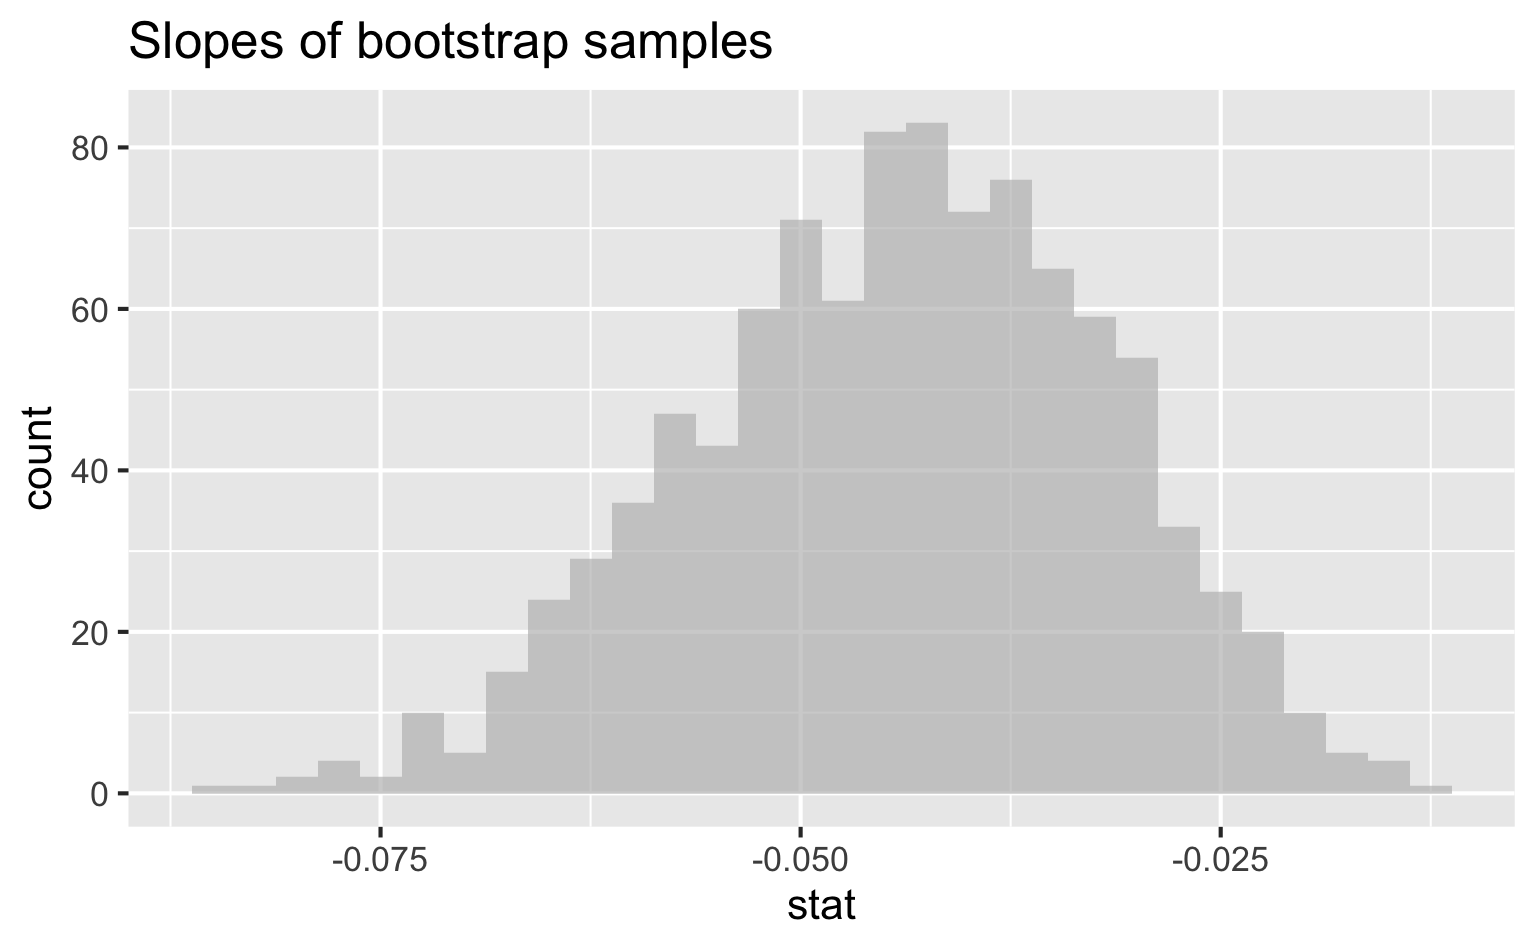
Slopes of bootstrap samples
95% confidence interval