Hypothesis testing
Modeling and inference
Setup
Packages
- tidyverse for data wrangling and visualization
- tidymodels for modeling
- openintro for data
Hypothesis testing
Hypothesis testing
A hypothesis test is a statistical technique used to evaluate competing claims using data
Null hypothesis, \(H_0\): An assumption about the population. “There is nothing going on.”
Alternative hypothesis, \(H_A\): A research question about the population. “There is something going on”.
Note: Hypotheses are always at the population level!
Setting hypotheses
Null hypothesis, \(H_0\): “There is nothing going on.” The slope of the model for predicting the prices of houses in Duke Forest from their areas is 0, \(\beta_1 = 0\).
Alternative hypothesis, \(H_A\): “There is something going on”. The slope of the model for predicting the prices of houses in Duke Forest from their areas is different than, \(\beta_1 \ne 0\).
Hypothesis testing “mindset”
Assume you live in a world where null hypothesis is true: \(\beta_1 = 0\).
Ask yourself how likely you are to observe the sample statistic, or something even more extreme, in this world: \(P(b_1 \leq -159~or~b_1 \geq 159 | \beta_1 = 0)\) = ?
Hypothesis testing as a court trial
Null hypothesis, \(H_0\): Defendant is innocent
Alternative hypothesis, \(H_A\): Defendant is guilty
- Present the evidence: Collect data
-
Judge the evidence: “Could these data plausibly have happened by chance if the null hypothesis were true?”
- Yes: Fail to reject \(H_0\)
- No: Reject \(H_0\)
Hypothesis testing framework
Start with a null hypothesis, \(H_0\), that represents the status quo
Set an alternative hypothesis, \(H_A\), that represents the research question, i.e. what we’re testing for
-
Conduct a hypothesis test under the assumption that the null hypothesis is true and calculate a p-value (probability of observed or more extreme outcome given that the null hypothesis is true)
- if the test results suggest that the data do not provide convincing evidence for the alternative hypothesis, stick with the null hypothesis
- if they do, then reject the null hypothesis in favor of the alternative
Calculate observed slope
… which we have already done:
Simulate null distribution
View null distribution
# A tibble: 2,000 × 3
# Groups:   replicate [1,000]
   replicate term       estimate
       <int> <chr>         <dbl>
 1         1 intercept 535890.
 2         1 area           8.64
 3         2 intercept 425016.
 4         2 area          48.5
 5         3 intercept 571721.
 6         3 area          -4.25
 7         4 intercept 516473.
 8         4 area          15.6
 9         5 intercept 472642.
10         5 area          31.4
# ℹ 1,990 more rows
Visualize null distribution
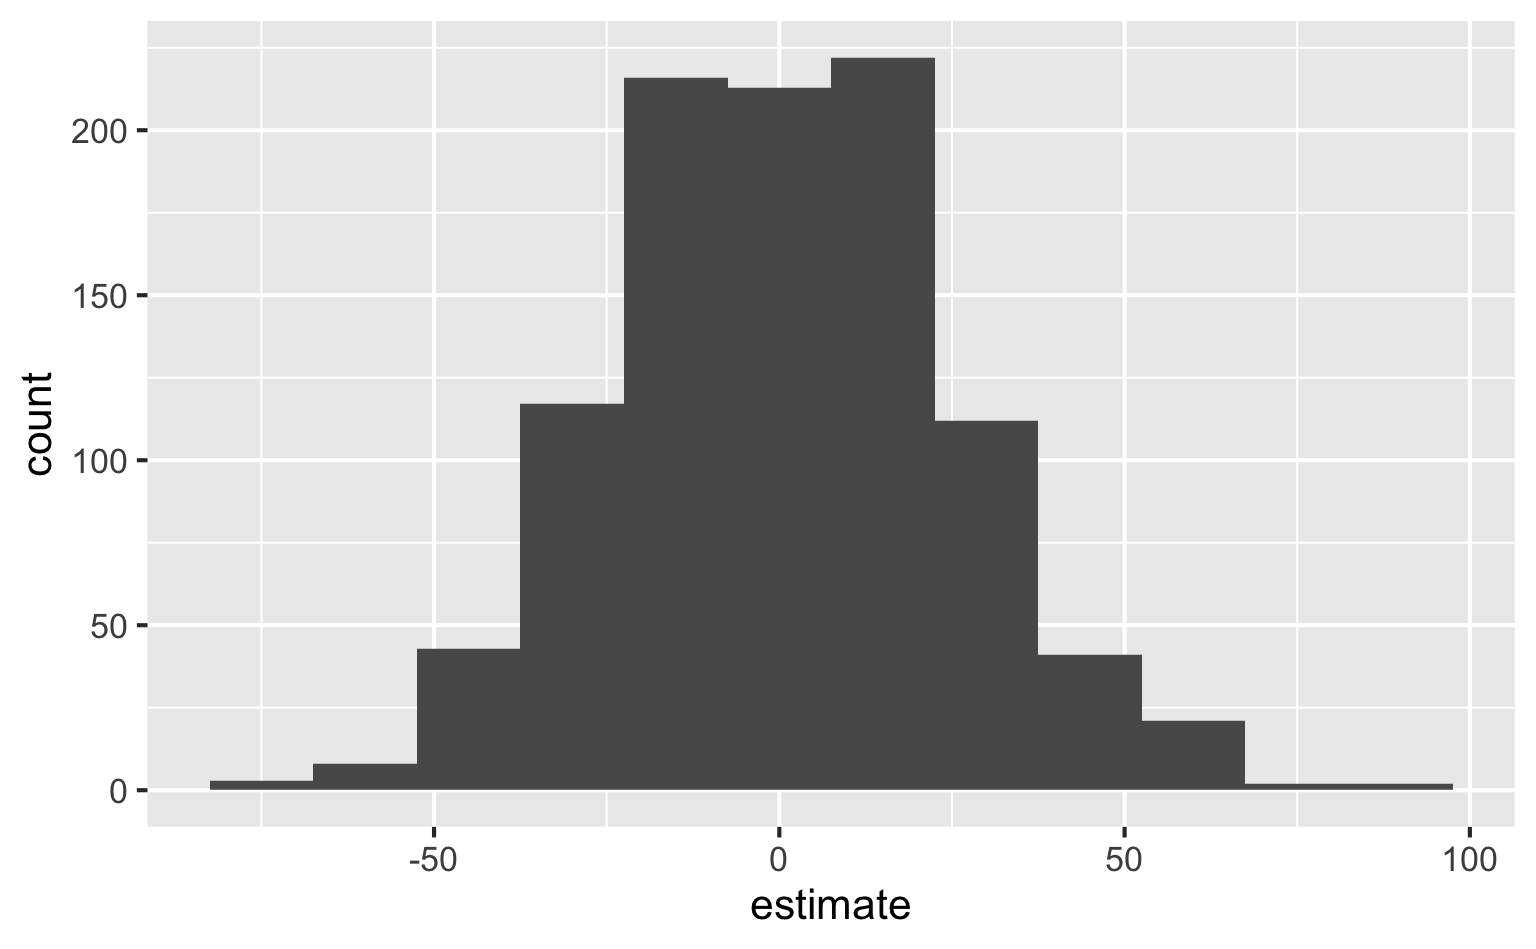
Visualize null distribution (alternative)
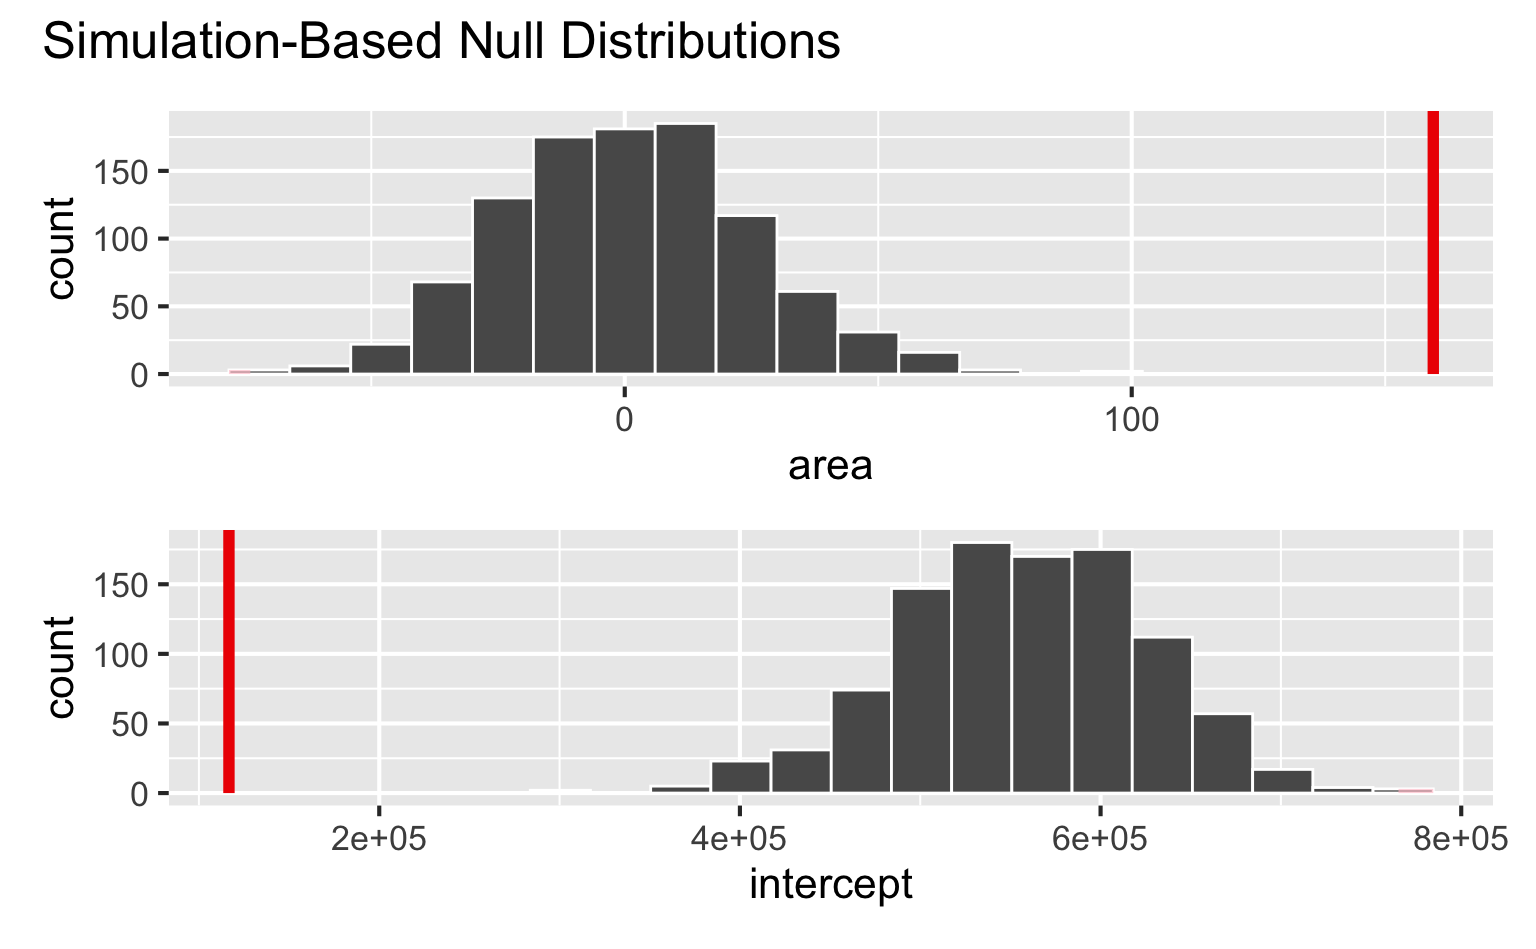
Get p-value
Warning: Please be cautious in reporting a p-value of 0. This result
is an approximation based on the number of `reps` chosen in
the `generate()` step.
ℹ See `get_p_value()` (`?infer::get_p_value()`) for more
  information.
Please be cautious in reporting a p-value of 0. This result
is an approximation based on the number of `reps` chosen in
the `generate()` step.
ℹ See `get_p_value()` (`?infer::get_p_value()`) for more
  information.
# A tibble: 2 × 2
term p_value
<chr> <dbl>
1 area 0
2 intercept 0Make a decision
Based on the p-value calculated, what is the conclusion of the hypothesis test?